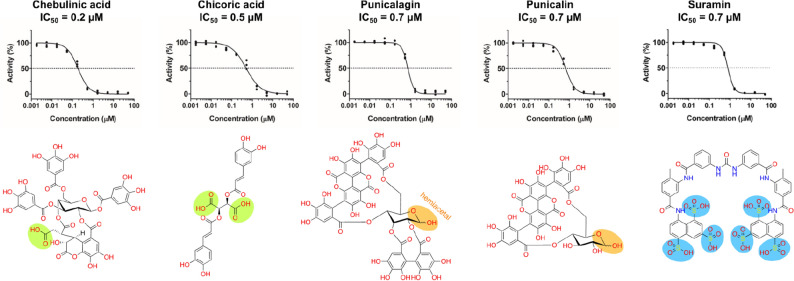
Figure 2.
Concentration–response curves and chemical structures of compounds identified as submicromolar N-protein-RNA1 disruptors in the HTS trials. Curves were measured in triplicates, normalized to positive and negative controls and fitted with the log 4-parameter curve in GraphPad Prism. The main non-phenolic functional groups were highlighted as follows: carboxylic acids (green); hemiacetal—in equilibrium with the aldehyde form—(orange); as well as the sulfonic acids (blue) for the polyamide suramin.

