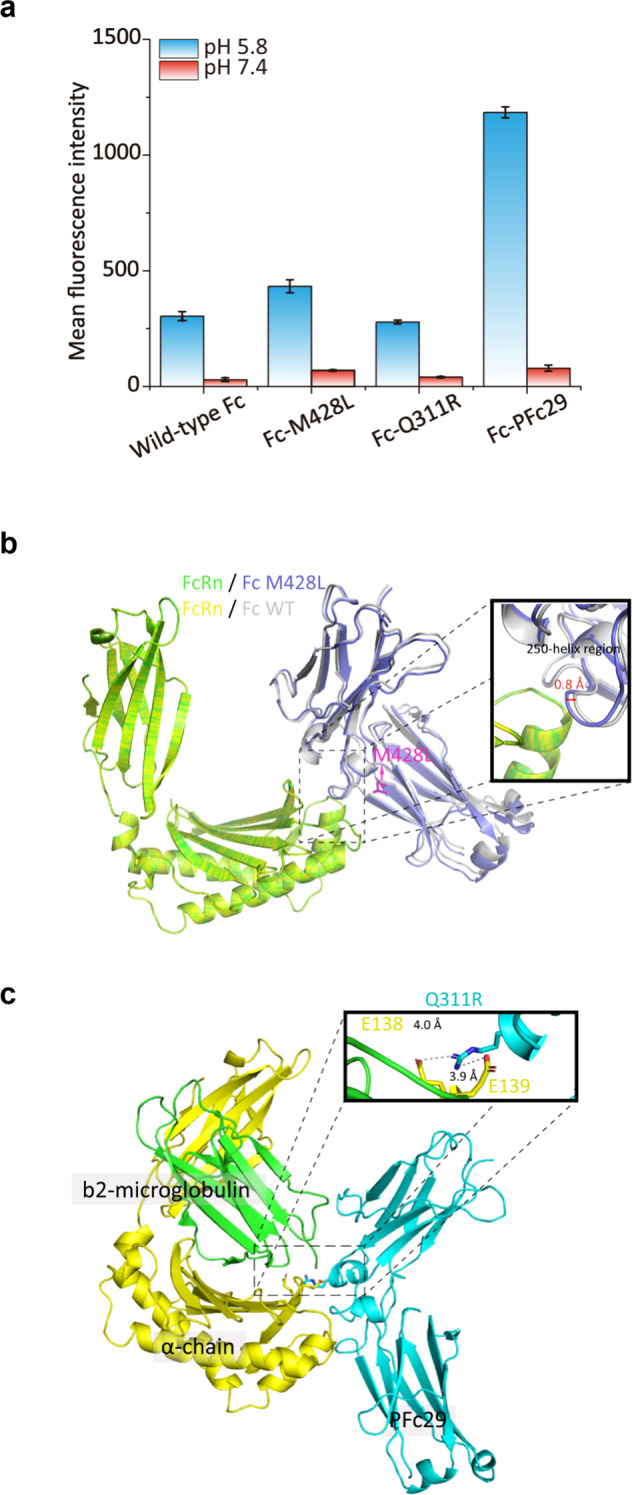
Fig. 3. Molecular interpretation of the improved PFc29 binding to hFcRn at pH 6.0.

a The combinatorial effects of the two mutations (Q311R and M428L) of PFc29 on hFcRn binding. For the FACS analysis, E. coli spheroplasts displaying an Fc variant (wild-type Fc, Fc-428L, Fc-Q311R, or Fc-PFc29) were labeled with 40 nM hFcRn-SA-Alexa 488 at pH 6.0 and pH 7.4. The mean fluorescence intensities (MFIs) resulting from the FACS analysis are represented as a bar graph. Error bars indicate the standard deviations calculated from triplicate samples. b Superposition of two complex model structures, hFcRn (green)/Fc-M428L (blue) and hFcRn (yellow)/wild-type Fc (white). To examine how the M428L mutation affects the distance between the Fc region and hFcRn, the two complex models (hFcRn/Fc-M428L and hFcRn/wild-type Fc) are superposed based on hFcRn Cα, and a zoomed-in view showing the interaction between hFcRn and the 250-helix region (residues K246–M252) is outlined with a thick line box. The bidirectional arrow in the box indicates the structural distance between Fc-M428L (blue) and wild-type Fc (gray), and the side chain of the M428L residue of Fc-428L is shown in stick representation (purple). c Molecular complex model of PFc29/hFcRn. PFc29, hFcRn α-chain, and β2-microglobulin are colored cyan, yellow, and green, respectively. A contact area close to Q311R is indicated by a box, and electrostatic interactions (Q311RPFc29–E138hFcRn or Q311RPFc29–E139hFcRn) are represented by dashed lines.
