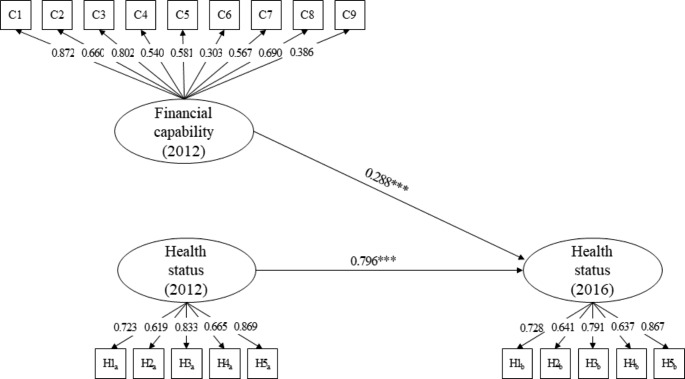
Fig. 1.
Structural path model.
Note. Factor loadings for each latent construct were standardized, and all factor loading were significant at p < .001 level. Paths showed in figure were standardized estimates. All latent variables were controlled for covariates. Results were estimated using weighted least square (WLSMV) to correct the categorical nature of indicators with 20 imputed data sets. Model fit: χ2 = 2358.014***, p < .001; CFI = 0.953; TLI = 0.944; RMSEA = 0.041. ***p < .001

