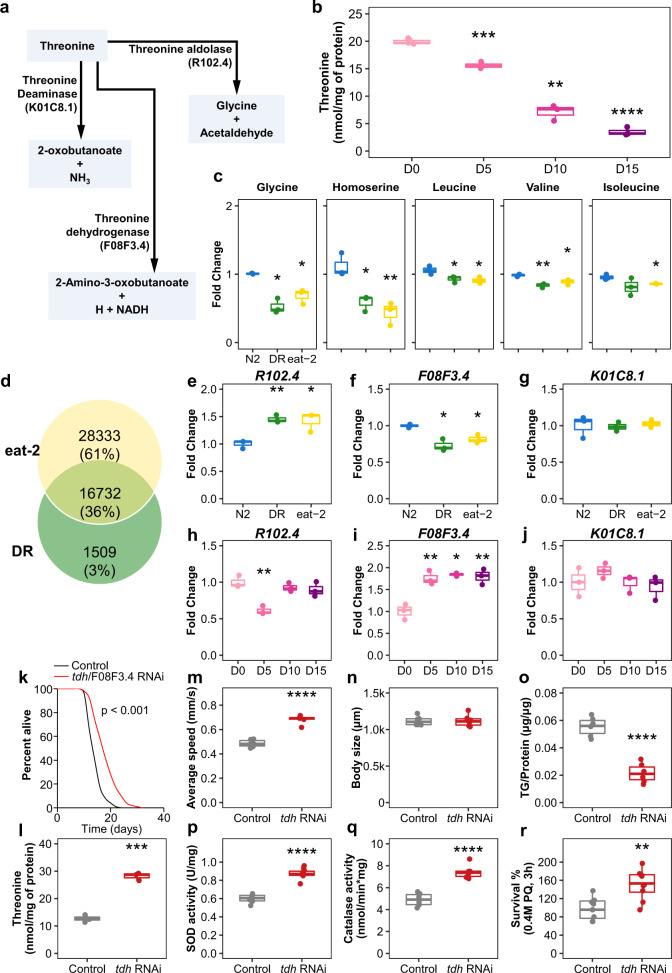
Fig. 2. Threonine declines with age and threonine catabolism disorder enhances lifespan and healthspan.
a Threonine is metabolized by threonine dehydrogenase (TDH) to 2-amino-3-ketobutylate, which then either spontaneously decarboxylates into aminoacetone or is metabolized by the GCAT enzyme using CoA as a co-substrate to form glycine and acetyl-CoA. b Threonine abundance decreased with age (***p < 0.001 versus the first time point, n = 3 worm pellets). c Glycine and homoserine decreased in DR or eat-2 nematodes (***p < 0.001 versus N2 group, n = 3 of 5-day-old-worm pellets). d Venn analysis of DR and eat-2 mutant using publicly available datasets. Intersection of differentially expressed genes (DEGs) of DR (p < 0.05 in edgeR, Deseq) with eat-2 mutant DEGs compared to the wild-type N2 (p < 0.05). e–g Among the common DEGs, the expression of enzymes that were related with threonine metabolism were determined as (e) R102.4 (**p < 0.01 and ***p < 0.001 versus the N2 group, n = 3 of 5-day-old-worm pellets), (f) TDH/F08F3.4 (***p < 0.001 versus the N2 group, n = 3 of 5-day-old-worm pellets), and (g) K01C8.1 (p > 0.05, n = 3 of 5-day-old-worm pellets). The expression of these enzymes was measured with age as (h) R102.4 (**p < 0.01 versus the first time point, n = 3 worm pellets), (i) TDH/F08F3.4 (**p < 0.01 and ***p < 0.001 versus the first time point, n = 3 worm pellets), and (j) K01C8.1 (p > 0.05). k Lifespan analysis of tdh/F08F3.4 RNAi (mean ± s.d, p < 0.001, log-rank test, n = 88–96 worms with 3 independent assays) versus control RNAi in N2 worms. l–r Effects of tdh/F08F3.4 RNAi versus control RNAi for (l) threonine contents (***p < 0.001, n = 3 worm pellets), (m) average speed (***p < 0.001, n = 10–15 worms with 3 independent assays), (n) body length (p = 0.785, n = 6), (o) triglyceride (TG) content (***p < 0.001, n = 3 worm pellets), (p) superoxide dismutase (SOD) activity (**p = 0.007, n = 3 worm pellets), (q) catalase activity (**p = 0.002, n = 3 worm pellets), and r oxidative stress resistance (***p < 0.001, n = 20 worms × 9 measurements each). b–c, e–j and m–r P values were determined by two-sided t-test. FDR < 0.05. Error bars represent the mean ± s.d. Source data are provided as a Source Data file.

