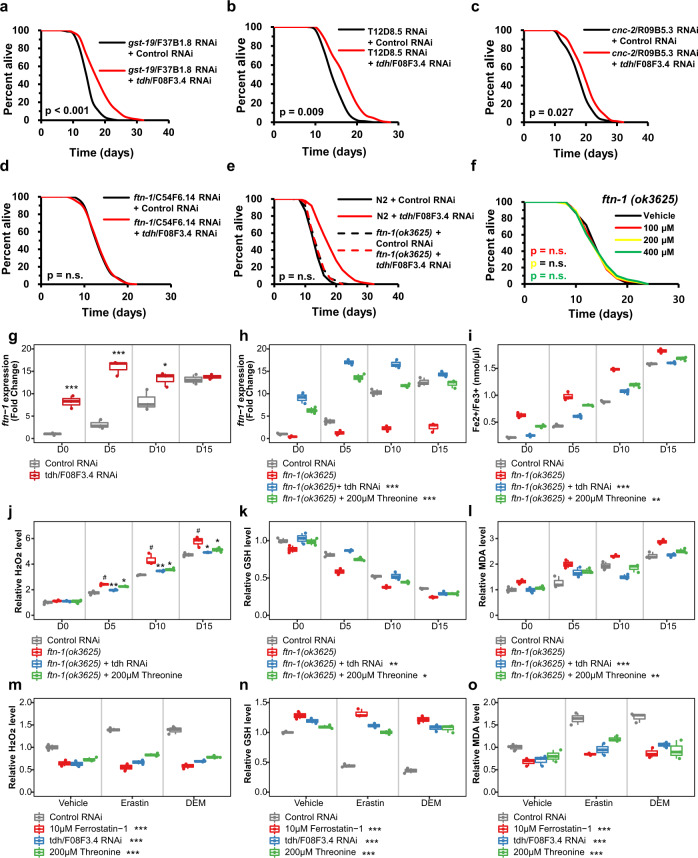
Fig. 4. Increasing threonine manipulations upregulate expression of ferritin protein, FTN-1, and FTN-1-mediated ferroptosis suppression.
a–d Lifespan assay of tdh/F08F3.4 RNAi (red) versus control RNAi (black) with transcripts of DAF-16 or HSF-1 among the commonly regulated genes of tdh/F08F3.4 RNAi, DR, and eat-2 (by Venn analysis, Supplementary Data 3), (a) gst-19/F37B1.8 RNAi, (b) T12D8.5 RNAi, (c) cnc-2/R09B5.3 RNAi, and d ftn-1/C54F6.14 RNAi worms. e Lifespan assay of ftn-1(ok3625) with tdh/F08F3.4 RNAi (red-dashed) versus control RNAi (black-dashed) compared with survival curves of N2 (bold-line). f Effects of threonine (100, 200, and 400 μM) versus the vehicle (black) on lifespan of the ftn-1(ok3625) mutant. P value and lifespan assay data summarized in Supplementary Table 1. g Expression of ftn-1 under tdh/F08F3.4 RNAi was determined at intervals across lifespan (*p < 0.05 and ***p < 0.001 versus control RNAi, n = 3 worm pellets). h Expression levels of ftn-1 under ftn-1/C54F6.14 RNAi (#p < 0.001 compared to control RNAi, ***p < 0.001 versus ftn-1 RNAi, n = 3 worm pellets). i Quantification of Fe2+/Fe3+ iron contents of nematode with ftn-1/C54F6.14 RNAi at intervals across lifespan (#p < 0.001 compared to control RNAi, **p < 0.01 and ***p < 0.001 versus the ftn-1 RNAi, n = 3 worm pellets). j Relative Amplex Red fluorescence in supernatant of worms (#p < 0.001 compared to control RNAi, *p < 0.05 and **p < 0.01 versus ftn-1 RNAi, n = 3 worm pellets). k Total glutathione (GSH) level was normalized to the GSH level in worms exposed to tdh/F08F3.4 RNAi or threonine (#p < 0.001 compared to control RNAi, *p < 0.05 and **p < 0.01 versus ftn-1 RNAi, n = 3 worm pellets). l Levels of the malondialdehyde (MDA), were measured and normalized against the mean of control RNAi-treated worms for independent samples (#p < 0.001 compared to control RNAi, **p < 0.01 and ***p < 0.001 versus the ftn-1 RNAi, n = 3 worm pellets). m–o Effects of tdh/F08F3.4 RNAi or threonine with ferroptosis inducer erastin or diethyl maleate (DEM) to induce GSH depletion as relative levels of m ROS, (n) GSH, and o MDA with ferroptosis inhibitor, ferrostatin-1 (***p < 0.001 versus control RNAi, n = 3 worm pellets). Overall differences between conditions were analysed by two-way ANOVA. Differences in individual values or between two groups were determined using two-tailed t-tests (95% confidence interval). Error bars represent the mean ± s.d. Source data are provided as a Source Data file.

