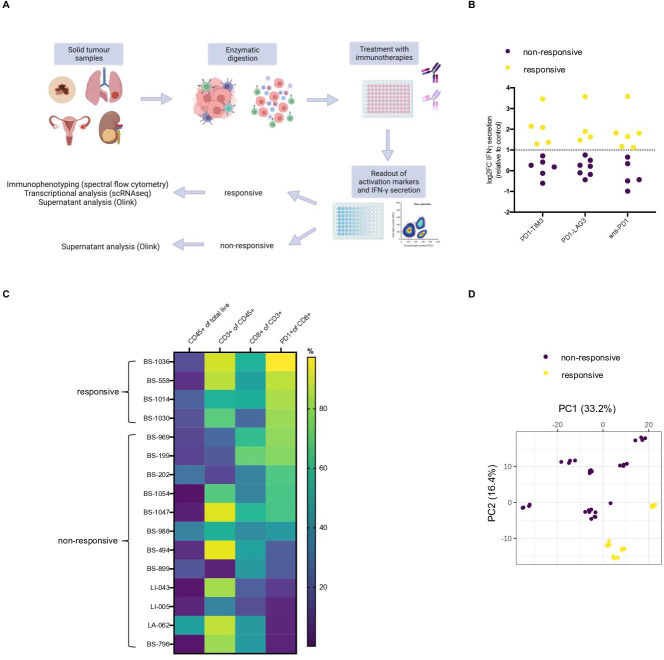
Figure 1.
Tumor infiltrating immune cells from selected patients show increased cytokine secretion and T cell activation in response to anti-PD-1, PD1-TIM3 and PD1-LAG3. (A) Schematic depicting treatment of tumor infiltrating immune cells from solid tumor (n=19) and pleural effusion (n=2) samples with bsAbs, anti-PD-1 or control isotype. Treatment (96 hours) was followed by assessment of activation by flow cytometry or IFN-γ, classification into responsive or non-responsive samples and further characterization by immunophenotyping, single-cell transcriptional analysis or multiplex supernatant analysis. (B) Log2 fold change (log2FC) in IFN-γ secretion comparing each treated sample (with levels of secretion above limit of detection, n of patients=11) to the isotype control. A threshold of 1 log2FC (dotted line) was applied to identify patient samples to be considered responsive to in vitro treatment. One responsive patient-derived pleural effusion sample (BS199) was excluded from further analyses due to differences in sample preparation. (C) Heatmap showing percentage of expression of selected surface markers in each patient tumor suspension samples (n=16) used in the in vitro experiments containing measurable live CD45+ cells. (D) PCA plot showing separation of tumor suspension samples (n=11, samples with sufficient supernatant that passed quality check) based on multiplex Olink supernatant analysis of 659 protein markers. Classification into responsive or non-responsive is indicated by the color legend. bsAbs, bispecific antibodies; IFN, interferon; LAG-3, lymphocyte-activation gene 3; PCA, principal component analysis; PD-1, programmed cell death protein 1; TIM-3, T cell immunoglobulin and mucin-domain containing-3.

