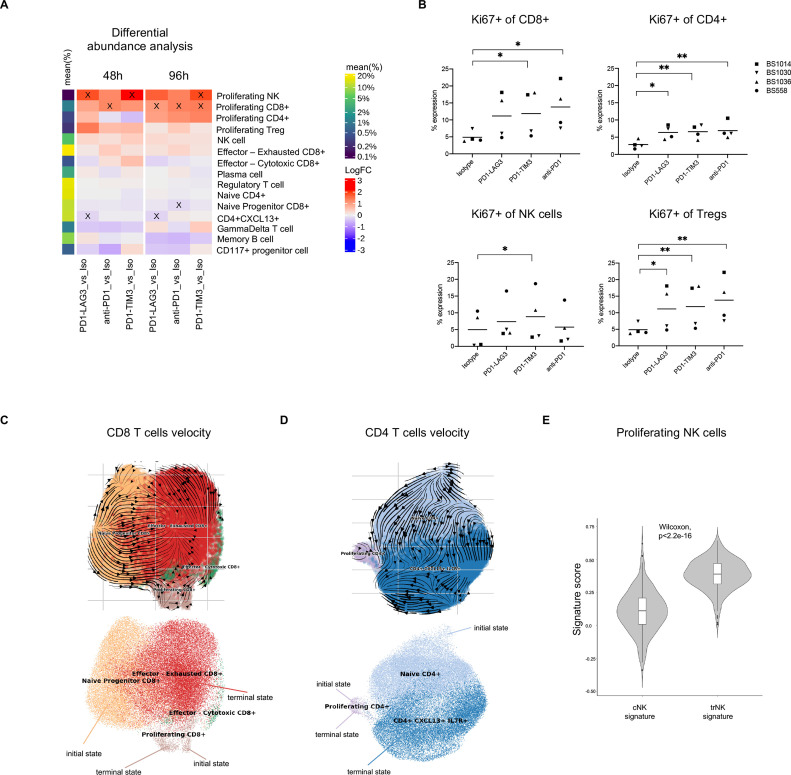
Figure 4.
RNA velocity toward a proliferating state is enhanced in human tumor infiltrating immune cells treated with single or dual inhibitory receptor blockade. (A) Differential abundance analysis of cell types in different conditions and at different timepoints across patients. The heatmap shows the log fold change (logFC) between each treatment-control comparison indicated at the bottom (per timepoint). Significant (FDR <0.1) changes are indicated with an X. Mean frequency (%) of each cell type out of the total number of cells is also indicated in the color legend. (B) Percentage expression of Ki67 on different T cell or NK cell clusters, manually gated (*p<0.05, **p<0.01, one-way ANOVA with multiple comparisons). (C) UMAP of CD8+ T cell subsets from pooled conditions (all treated cells from the 96-hour timepoint) with projected RNA velocity vectors (top) and putative initial and terminal (bottom) states. (D) UMAP of conventional CD4+ T cell subsets (excluding Treg cells) from pooled conditions (all treated cells from the 96-hour timepoint) with projected RNA velocity vectors (top) and putative initial and terminal (bottom) states. (E) Violin plot showing cNK or trNK signature score distribution in cells from the proliferating NK cluster, calculated using AddModuleScore function within Seurat in R; p value was determined with a Wilcoxon paired test. ANOVA, analysis of variance; cNK, conventional NK; FDR, false discovery rate; NK, natural killer; trNK, tissue-resident NK; Treg, regulatory T cell.

