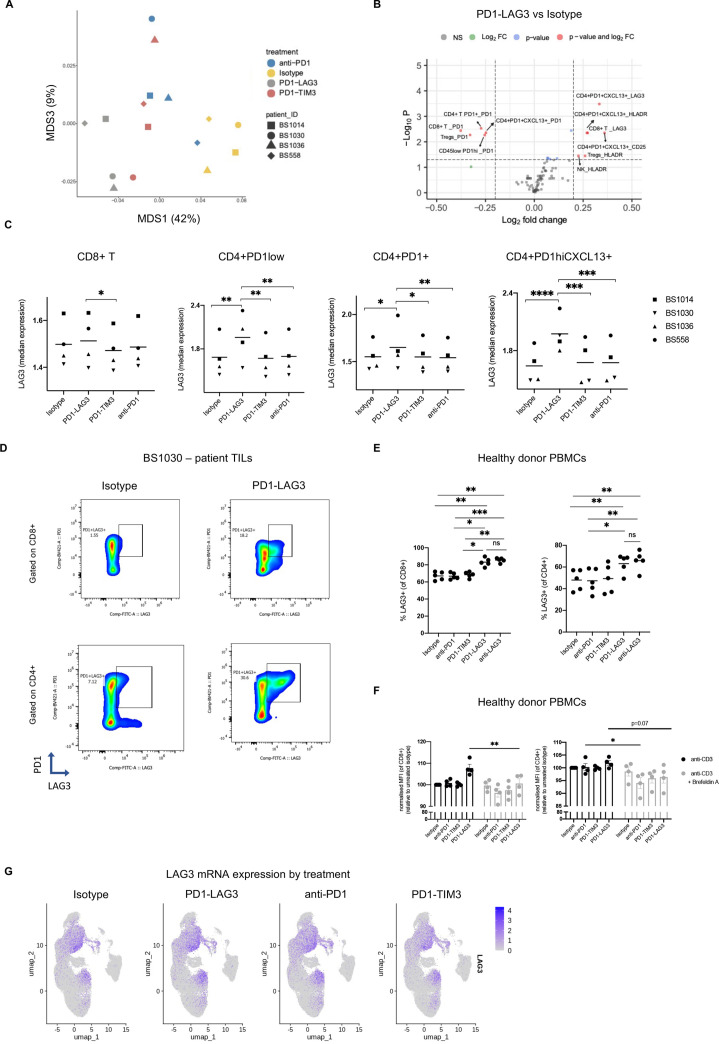
Figure 6.
LAG-3 surface upregulation is an anti-LAG-3-specific effect which does not require anti-PD-1. (A) Multidimensional scaling plots of each indicated sample, based on the scaled and transformed fluorescence intensities of each marker on all cell populations and batch-adjusting by patient (using ComBat in R40), indicating the distance in similarity between samples. (B) Volcano plot depicting differentially expressed markers (logFC >|1.5|, adjusted p value <0.05) within each cell subset across patients in the PD1-LAG3-treated condition compared with the isotype control. The color legend indicates significant values according to the indicated thresholds. The values were obtained by running a linear mixed model using the median marker intensities of each population based on FlowSOM clustering. (C) Median marker intensity of LAG-3 on different T cell populations in the four responsive tumor suspensions in different treatment conditions. Clustering was conducted using FlowSOM (*p<0.05, **p<0.01, ***p<0.001, ****p<0.0001, one-way ANOVA with multiple comparisons). (D) Representative dot plots showing expression of PD-1 and LAG-3 on CD8+ or CD4+ T cells from patient BS1030 tumor suspension in indicated treatment conditions. (E) Frequency of LAG-3+CD8+ (left) or CD4+ (right) T cells from healthy donor PBMCs, treated with isotype control, anti-PD-1, PD1-TIM3, PD1-LAG3 or an anti-LAG-3 antibody. P value was obtained by running two-way ANOVA with multiple comparisons (*p<0.05). Each dot indicates and independent PBMC donor (n=4). (F) Geometric MFI of LAG-3 surface expression on CD8+ (left) or CD4+ (right) T cells from anti-CD3 (clone OKT3) prestimulated healthy donor PBMCs, treated with isotype control, anti-PD-, PD1-TIM3 or PD1-LAG3 in the presence or absence of Brefeldin A. P value was obtained by running two-way ANOVA with multiple comparisons (*p<0.05). MFI is normalized to the isotype control, each dot indicates and independent PBMC donor (n=3). (G) UMAP projections showing average LAG-3 expression in all cells deriving from different treatment conditions. ANOVA, analysis of variance; FC, fold change; LAG-3, lymphocyte-activation gene 3; MFI, mean fluorescence intensity; PBMC, peripheral blood mononuclear cell; PD-1, programmed cell death protein 1; TIM-3, T cell immunoglobulin and mucin-domain containing-3.

