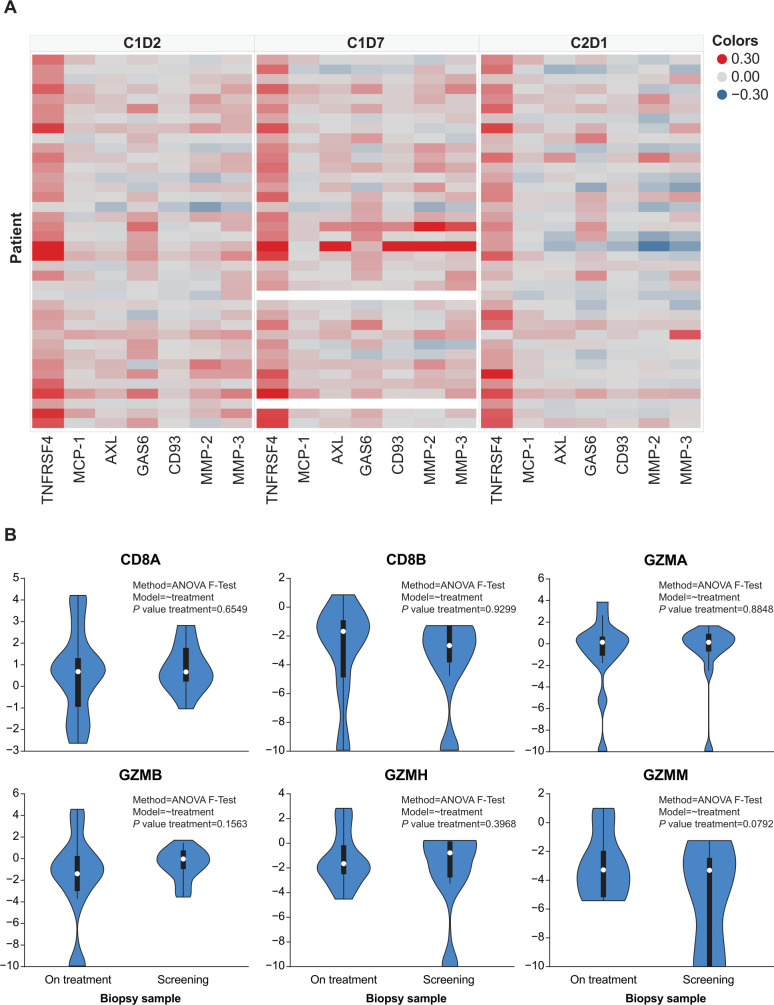
Figure 4.
Plasma protein analysis and transcriptomic analysis in tumor samples of patients treated with INCAGN01949. (A) Heat map of immune-related plasma protein expression. Log2-fold change in plasma proteins identified to be differentially expressed between C1D1 and either C1D2, C1D7, and/or C2D1 in the cohorts of 70, 200, and 350 mg. (B) Violin plot of biopsy CD8+ T cell-related gene expression. Gene expression was analyzed in biopsy samples collected at screening (pretreatment) and on treatment. Statistical significance was calculated using ANOVA F-test; genes depicted reached statistical significance (p<0.05). ANOVA, analysis of variance; C, cycle; D, day; GZMA, granzyme A; GZMB, granzyme B; GZMH, granzyme H; GZMM, granzyme M.

