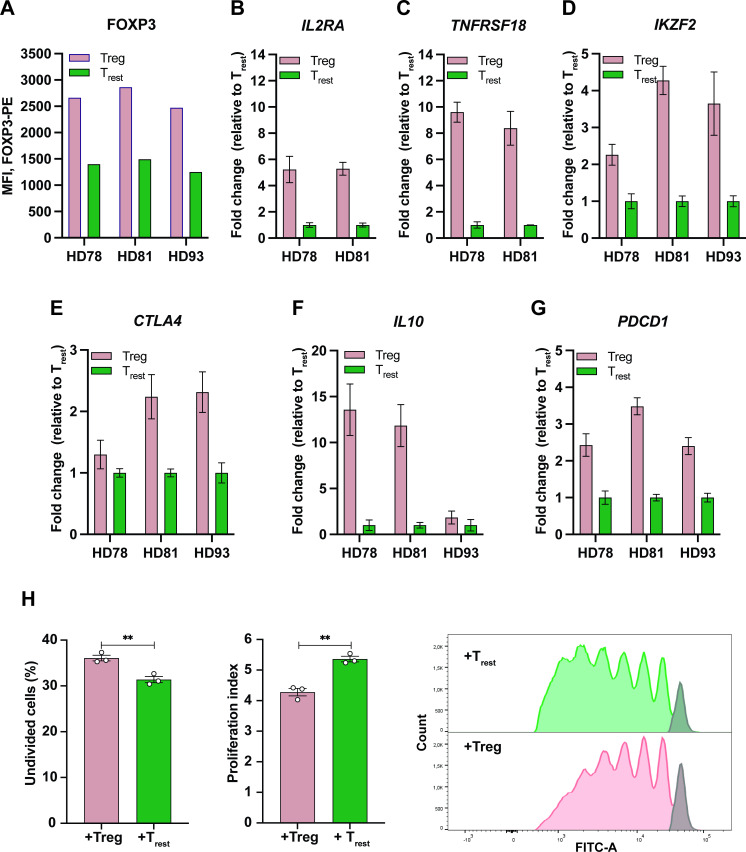
Figure 5.
Characterization of sort-purified Tregs. (A) MFI of FOXP3-PE in sorted Tregs and Trest from the three donors following intracellular staining. (B–F) RT-qPCR analysis of the expression of IL2RA (B), TNFRSF18 (C), IKZF2 (D), CTLA4 (E), or IL10 (F) in the Tregs and Trest. The expression of each Treg signature gene was normalized to the housekeeping gene POL2RA and presented as fold change versus Trest with bars showing the mean±SD of technical triplicates. (G) RT-qPCR analysis of PDCD1 expression in Tregs and Trest. Data is represented as relative expression to the housekeeping gene POL2RA (arbitrary units) with bars showing the mean±SD of technical triplicates. (H) In vitro Treg suppression assay. (Left) Percentage of undivided CD8+ T cells after 5 days of co-culture with sort-purified Tregs (+Treg) or Trest (+Trest). Bars indicate the mean of three technical triplicates (depicted as dots). **P=0.0069 (unpaired t-test). (Middle) Proliferation index of CD8 T cells after 5 days of coculture with Tregs or Trest. Bars indicate the mean of three technical triplicates (depicted as dots). **P=0.0022 (unpaired t-test). (Right) CFSE staining of CD8+ T cells cocultured with Tregs or Trest for 5 days. The gray bar depicts the undivided population. CFSE, carboxyfluorescein succinimidyl ester; IL, interleukin; MFI, mean fluorescence intensity; Treg, regulatory T cell; Trest, resting T cell.

