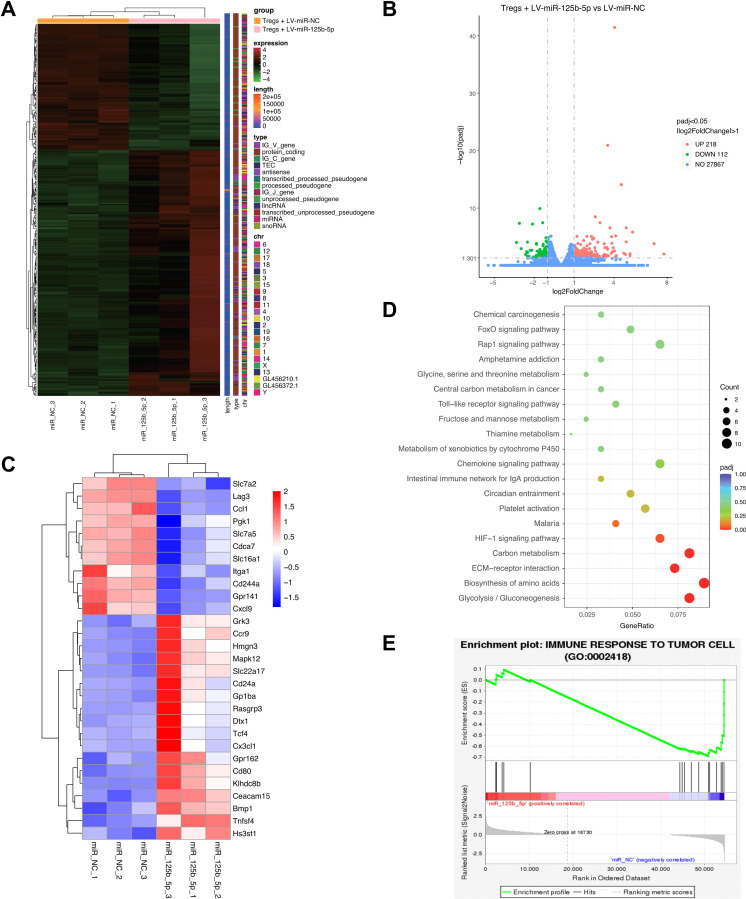
Figure 4.
RNA-seq analysis of differentially expressed genes in miR-125b-5p transfected Tregs. Purified CD4+CD25+ Treg cells were transfected with 100 nM LV-miR-125b-5p or its negative control (LV-miR-NC) for 2 days, then transcriptome sequencing was performed. (A) The differentially expressed genes in miR-125b-5p overexpressed Tregs compared with control cells (n=3, each group) were shown in the heatmap. (B) The differentially expressed genes were shown in volcano plot. X-axis means log2 foldchange; Y-axis means −log10pvalue. Gray dotted line represents the screening standard threshold of different expressed genes. (C) The selected most upregulated and downregulated genes were shown in heatmap. (D) KEGG pathway analysis of enriched differentially expressed genes. (E) Gene Set Enrichment Analysis (GSEA) using Tregs RNA-seq data showed that miR-125b-5p expression levels affect regulation of immune response to tumor cell progression.

