Figure 6.
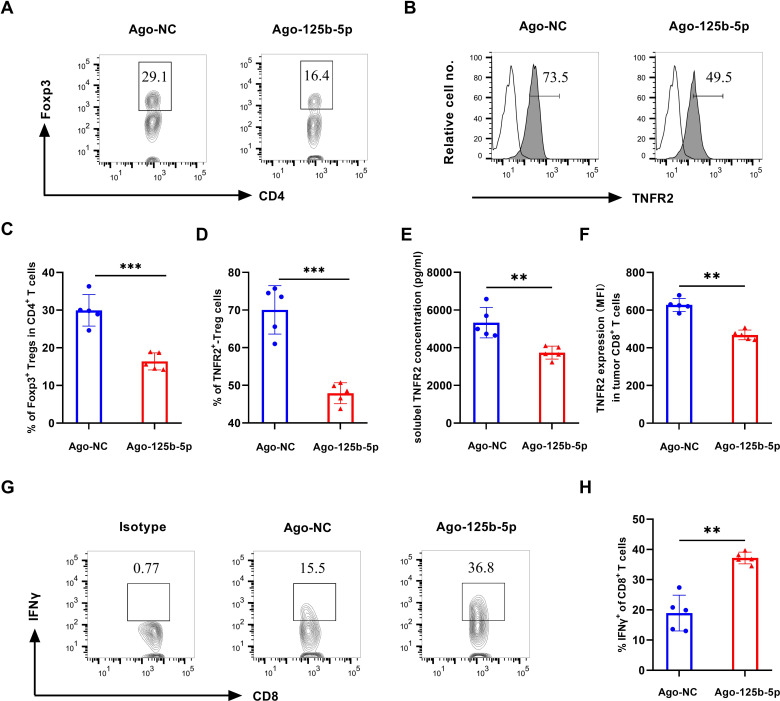
Effect of Ago-125b-5p on the tumor infiltration Tregs and TNFR2 expression and on cytotoxic CD8 T cells. After treatment by Ago-125b-5p for five doses on MC38 tumor-bearing mice, the immune cells in tumor tissue were detected by flow cytometry. (A) Representative flow cytometric plot of the proportion of Tregs in CD4+ T cells in mouse tumor tissue after treated by Ago-125b-5p. Number shows the proportion of gated cells. (B) Representative typical histograms of TNFR2 expression in Foxp3+ Tregs. Number in the histogram indicates the proportion of gated cells. (C) Summary of the proportion of FoxP3+ Tregs in CD4 populations as shown in figure part A. (D) The expression of TNFR2-expressing cells in Tregs. (E) The concentration of soluble TNFR2 levels in serum after treated by Ago-125b-5p. (F) The mean fluorescence intensity (MFI) of TNFR2 expression by tumor-infiltrating CD8+ T cells. (G) Representative flow cytometric plot of the proportion of IFNγ+CD8+ T cells in CD8+ T cells in mouse tumor tissue after treated by Ago-125b-5p. Number shows the proportion of gated cells. (H) Summary of the proportion of IFNγ+CD8+ T cells in CD8+ T cells. The summarized data shown in figure parts C, D, E, F and H were displayed as mean±SEM, n=5 mice of each group. All data were representatives of three separate experiments. By comparison with Ago- NC, *p<0.05, **p<0.01, ***p<0.001 (Student’s t-test). TNFR2, tumor necrosis factor receptor type 2.

