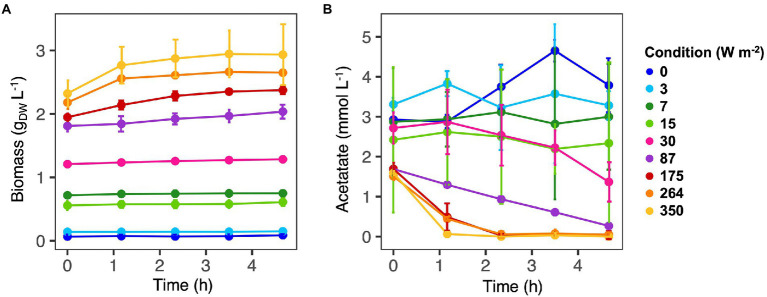
Figure 1.
Biomass (A) and acetate (B) concentrations along the SBR cycles. Values are expressed as the average value for each time point. Samples were collected for three cycles. At high light intensities (350–87 W m−2) acetate was fully consumed at the end of the reaction cycles. At low light intensity (30–0 W m−2) acetate was still present at the end of the reaction phase and biomass growth was negligible.

