FIGURE 1.
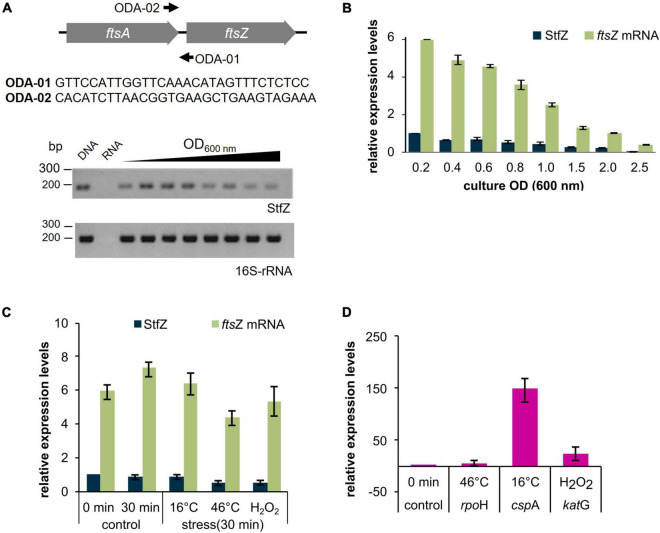
Detection and expression of StfZ RNA in stress conditions. RT-PCR for the detection of StfZ transcript. (A) The upper panel shows the location of the primers ODA-01 and ODA-02 used for StfZ RT-PCR and the sequence of the primers. Oligo ODA-02 was used for StfZ cDNA synthesis. The lower panel shows the RT-PCR products of StfZ and 16S rRNA after 30 cycles of amplification. G-DNA, genomic DNA as the positive control; RNA, RNA sample from 0.6 OD as the negative control; and cDNA from 0.2 to 2.5 OD cultures. The RT-PCR products were of 177 bp (StfZ) and 218 bp (16S-rRNA). (B) Bar-graph for the relative levels of the ftsZ and StfZ transcripts. Real-time PCR of ftsZ mRNA (green) and StfZ transcript (dark blue) from E. coli K12 cells from 0.2 to 2.5 OD cultures were performed on cDNA synthesised with ODA-06 oligo (for ftsZ) and ODA-02 oligo (for StfZ). Relative levels of ftsZ mRNA and StfZ are normalised to StfZ level from 0.2 OD. (C) Real-time PCR of ftsZ mRNA (green) and StfZ (dark blue) from K12 cells. Cells were stressed for 30 min at 16°C, 46°C, and 5 mM of H2O2 exposure. The bar graph represents the levels of the transcripts to StfZ at 0 min. (D) Real-time PCR of rpoH, cspA, and katG mRNA levels (markers for stress response) after 30 min of heat shock (Grossman et al., 1984), cold shock (Etchegaray et al., 1996), and oxidative stress (Erickson et al., 1987) response, respectively. Expression level from the uninduced culture was used as the expression control.

