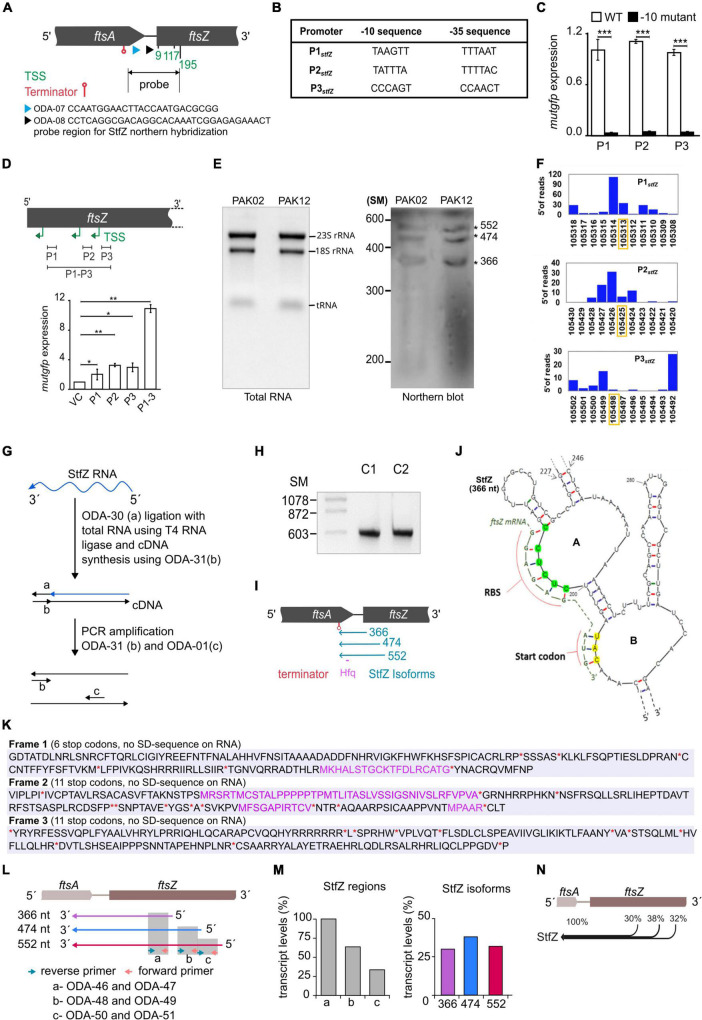
FIGURE 2.
Identification of the 5′ end, the promoters, and the 3′ end of StfZ. (A) Schematic representation of the positions of the oligonucleotides used for primer extension analysis (PEA), which identified TSS sites and terminator. ODA–07 (blue), ODA–08 (black), TSS (green), and terminator (red). The double arrow line indicates the location of the probe used for northern blotting in 2E. (B) Putative promoters of the stfZ with their respective –10 and –35 sequences predicted from the PEA products. (C) Promoter assay using mutgfp as a reporter in pFPV27 vector. P1, P2, and P3 predicted promoters with native sequence (WT) (white bars) and respective –10 deletion mutant –10 mutant (black bars) were cloned upstream to mutgfp. Strain PAK05 (P1 wt), PAK07 (P2 wt), PAK09 (P3 wt), PAK06 (P1Δ-10), PAK08 (P2Δ-10), and PAK10 (P3Δ-10) were used. Y-axis indicates the relative expression. (D) Relative activity of stfZ promoters, P1, P2, and P3, individually and cumulative were analysed in PAK05, PAK07, PAK09, and PAK11 (P1 + P2 + P3) strains, respectively. The illustration (top) shows the cloned promoter regions (black horizontal lines). pFPV27 was used as the vector control. Bar graphs show the relative expression of mutgfp (y-axis) from different promoters (x-axis). The p-values range were indicated with asterisks (***p < 0.001). (E) Northern blot for PAK02 and PAK12 RNA samples. PAK02 and PAK12 were probed with a single-stranded RNA probe. RNA ladder was used as a size marker. The asterisks indicate three bands of expected sizes, 366, 474, and 552 nt, approximately. (F) Transcription start site (TSS) frequency bar-plot from the existing RNA seq data represents the surrounding region of the StfZ 5′ end identified by primer extension. stfZ-P1, stfZ-P2, and stfZ-P3 in this graph represent the promoters of TSS–9, TSS–117, and TSS–195. The Y-axis on each graph represents the number of reads starting on each position and the X-axis represents the genomic positions. RNA-Seq data was extracted from NCBI-SRA (accession number- SRX3413960). The orange box shows the TSS determined from PEA in this study. (G) Strategy for 3′ RACE to identify the 3′ end of StfZ RNA. (H) The approximate size of the 3′ RACE product is 600 bp. C1 and C2 are two biological replicates of 3′ RACE. SM, size marker in nucleotides. (I) Concise diagram indicating the location of StfZ isoforms at ftsA-ftsZ locus. Identified terminator position from 3′ RACE (red) predicted Hfq binding site (magenta), and different isoforms with their respective sizes (blue). (J) 5′ region of the predicted secondary structure of StfZ RNA (366 nt) from the Mfold web server. The ftsZ (yellow) ribosomal binding site (RBS) and of the AUG start codon complementary to the StfZ structure are shown next to the open loops, A and B, respectively. (K) In silico analysis of StfZ sequence for peptide reading frame. In black, peptides start without methionine; in violet, peptides start with methionine; and in red asterisk ‘*’ and ‘**’, stop codons. Ribosome binding sites are not present in the entire StfZ RNA sequence. (L) Primer map for real-time PCR to estimate the levels of individual StfZ isoforms. Isoforms 366, 474, and 552 are indicated as arrows below the gene locus of ftsA-ftsZ in violet, blue, and red, respectively. Green and orange arrows indicate the reverse and forward primers. Grey boxes, “a,” “b,” and “c,” show the coverage from the primers as mentioned in the lower panel. (M) Bar graphs for the transcript levels of StfZ regions and isoforms. The bar graph in the left panel shows the transcript levels detected from regions “a,” “b,” and “c” (grey bars). The relative amount was calculated with respect to the region “a” taken as 100%. The bar graph in the right panel shows the relative levels of three StfZ isoforms as percent transcript. Violet- StfZ 366, blue- StfZ 474, and red- StfZ 552. Y-axis, percent transcript levels. (N) Map of StfZ isoforms and their contribution to StfZ RNA pool. Black merging horizontal lines with reference to ftsA-ftsZ genomic locus (top) show isoforms with relative amounts of their transcripts.

