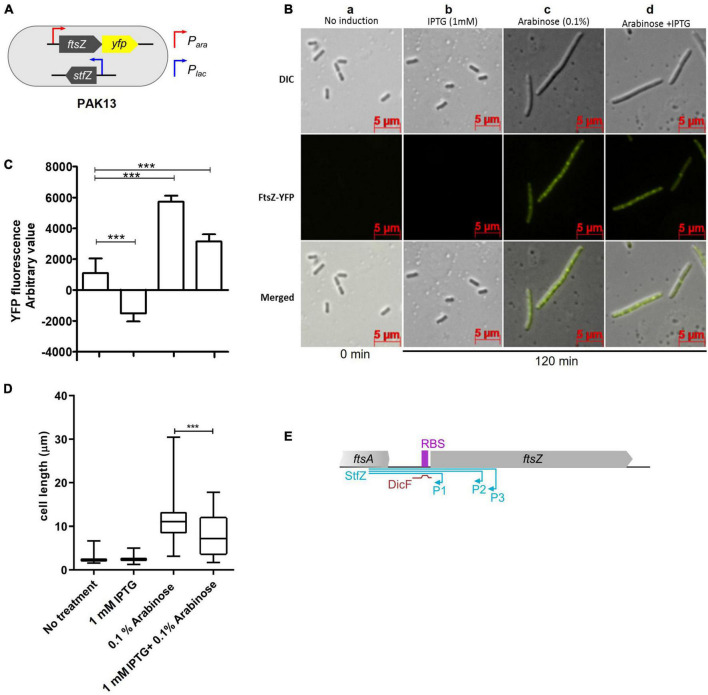
FIGURE 3.
Inhibition of ftsZ-yfp mRNA translation by StfZ. PAK13 cells were induced with either 1 mM IPTG or/and 0.1% arabinose at 37°C for 120 min. (A) Schematic presentation of PAK13 strain with Para-ftsZ-yfp and Plac-stfZ constructs. (B) Cells were imaged before induction (0 min) and after induction for 120 min. Columns: (a) negative control without induction of the culture; (b) positive control for StfZ RNA expression, induced with IPTG; (c) positive control for FtsZ-YFP expression, induced with arabinose; (d) experimental sample, induced for the co-expression of StfZ RNA and ftsZ-yfp fusion mRNA. Top row: DIC images; middle row: FtsZ-YFP images; and lower row: merged images. (C) Quantitation of the YFP fluorescence as arbitrary values for 0 min and 120 min post-induction from 200 μl culture. (D) Box chart for cell size at 0 min and 120 min of induction (n > 300). (E) Diagram representing the span of StfZ and DicF antisense RNA on ftsZ sequence. The stfZ (blue line) covers the complete intergenic region and a significant portion of ftsZ while DicF (brown line) partially covers the intergenic region. Statistical significance is indicated with asterisks (***p < 0.001).

