FIGURE 4.
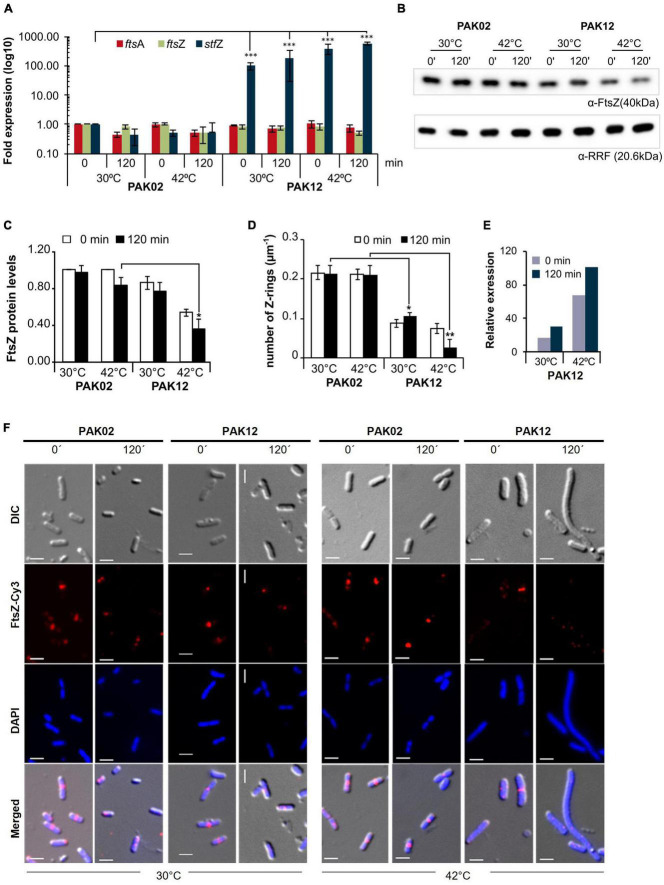
StfZ over induction decreases FtsZ level and blocks cell division. (A) Real-time PCR for StfZ, ftsZ, and ftsA mRNA at 30 and 42°C in PAK02 (vector control) and PAK12 (StfZ expression) strains. (B) Western blot analysis for FtsZ level and equal loading profile of RRF protein (Ribosome-recycling factor). (C) Bar-graph for the quantitation of FtsZ from western blot. FtsZ level was calculated to PAK02 sample from 0 min at 30°C. (D) Bar-graph showing ratio of FtsZ rings per micron of cell length (n > 100). Cells were fixed after 0 min and 120 min of induction and immunostained for FtsZ. The total number of Z-ring was divided by the cumulative cell length of the population. (E) Estimation of relative RNA expression of StfZ compared to ftsZ mRNA at 30 and 42°C. Bar-graph showing RNA levels of StfZ RNA from real-time PCR data [data from panel (A)] normalised with ftsZ level by 6-fold. (F) Immunostaining for FtsZ in PAK02 and PAK12 cells from 30 and 42°C cultures. For each temperature (bottom), left panel PAK02 (vector control) and right panel PAK12 (StfZ expression) at 0 min and 120 min are shown. FtsZ-Cy3 (red) and DAPI (blue). Scale bar, 5 μm. Statistical significance is indicated with asterisks (*p < 0.05, **p < 0.01, ***p < 0.001).

