
Figure 2. SOX2 Mediates Infection of GSCs Associated with Repression of Innate Antiviral Responses.
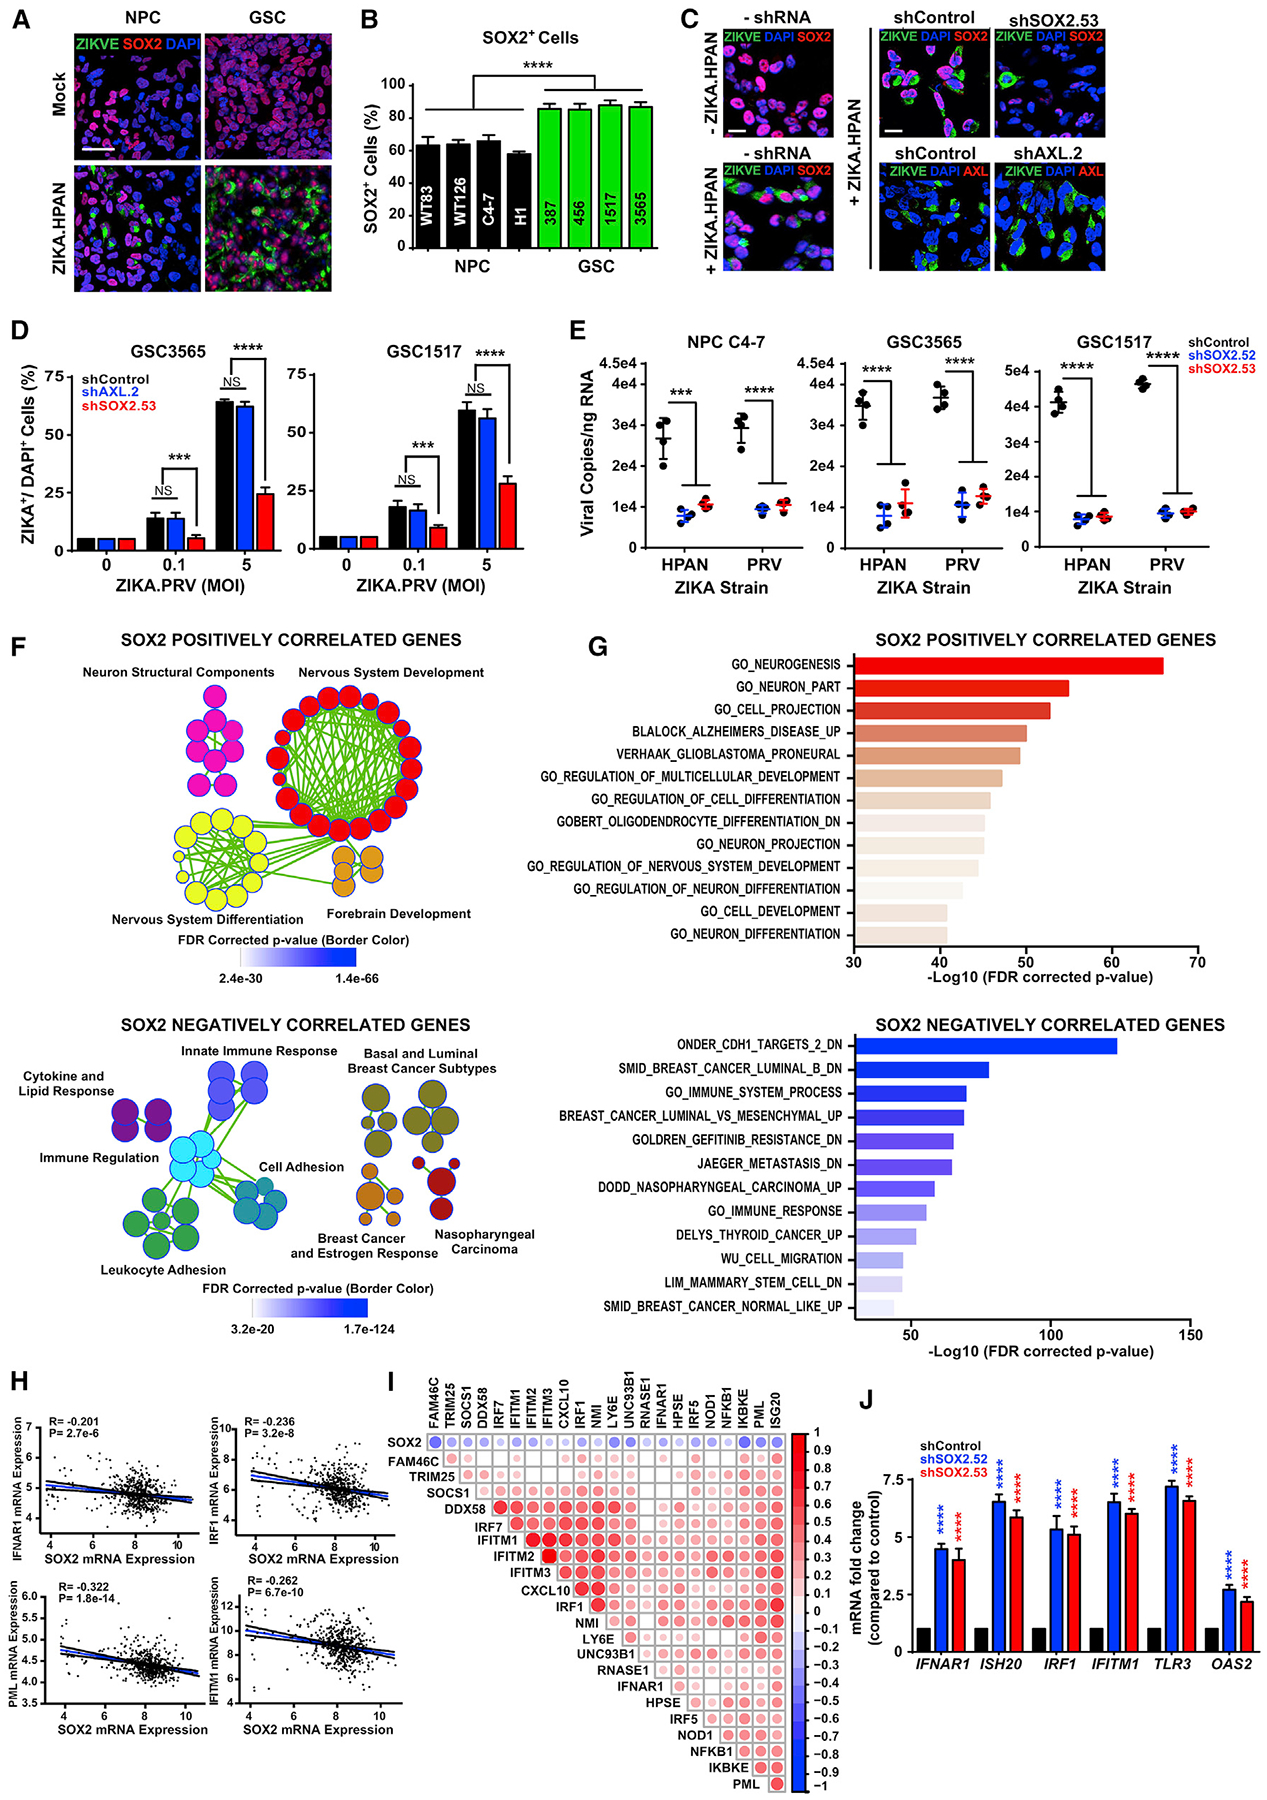
(A) Representative immunostaining for ZIKV-E (green), SOX2 (red), and DAPI (blue) of GSCs and forebrain-specific hiPSC-derived NPCs 48 h p.i. with ZIKV. Scale bar, 50 μm.
(B) Quantification of the percentage of SOX2+ cells in DAPI+ cells for GSCs and NPCs 48 h p.i. with ZIKV.
(C) Representative immunostaining for ZIKV-E (green), SOX2 or AXL (red), and DAPI (blue) of GSCs (GSC3565) without transduction (shRNA) or transduced with control shRNA (shCONT), AXL shRNA (shAXL.2), or SOX2 shRNA (shSOX2.53) for 72 h and then 48 h with ZIKV infection. Scale bars, 100 μm.
(D) Quantification of the percentage of ZIKV+ cells in DAPI+ cells in GSCs 1517 and 3565 under conditions for (C), with a range of ZIKV infection.
(E) Viral copy number by qRT-PCR of GSCs (GSC3565 or GSC1517) or NPC C4–7 transduced with either shCONT or SOX2 shRNA (shSOX2.52 or shSOX2.53) for 72 h and then either exposed to mock conditions or infected with ZIKV for another 72 h. All comparisons are versus shCONT.
(F) Gene set enrichment (GSE) bubble plots showing pathways positively (top, r > 0.4) or negatively (bottom, r < −0.4) correlated with SOX2 expression in the TCGA GBM HG-U133A microarray dataset. Each circle represents an enriched pathway, with the border color indicating the false discovery rate (FDR)-corrected p value.
(G) GSE graph showing the top pathway enrichments positively or negatively correlated with SOX2 as described in (F).
(H) Correlation of mRNA levels of SOX2 with IFNAR1, IRF1, promyelocytic leukemia (PML), and IFITIM1 from the TCGA GBM HG-U133A microarray dataset.
(I) Correlation between SOX2 with ISGs from the TCGA GBM HG-U133A microarray dataset. The size and color of the dots indicate the degree of correlation (p < 0.001). Blank cells indicate a non-significant correlation.
(J) qPCR of ISGs (IFNAR-1, ISH20, IRF1, IFITM1, TLR3, and OAS2) in GSCs (GSC3565) transduced with either shCONT or SOX2 shRNA (shSOX2.52 or shSOX2.53).
Experiments were performed in two biological replicates with three technical repeats. Values represent mean ± SEM. **p < 0.001, ****p < 0.0001 by one-way ANOVA.