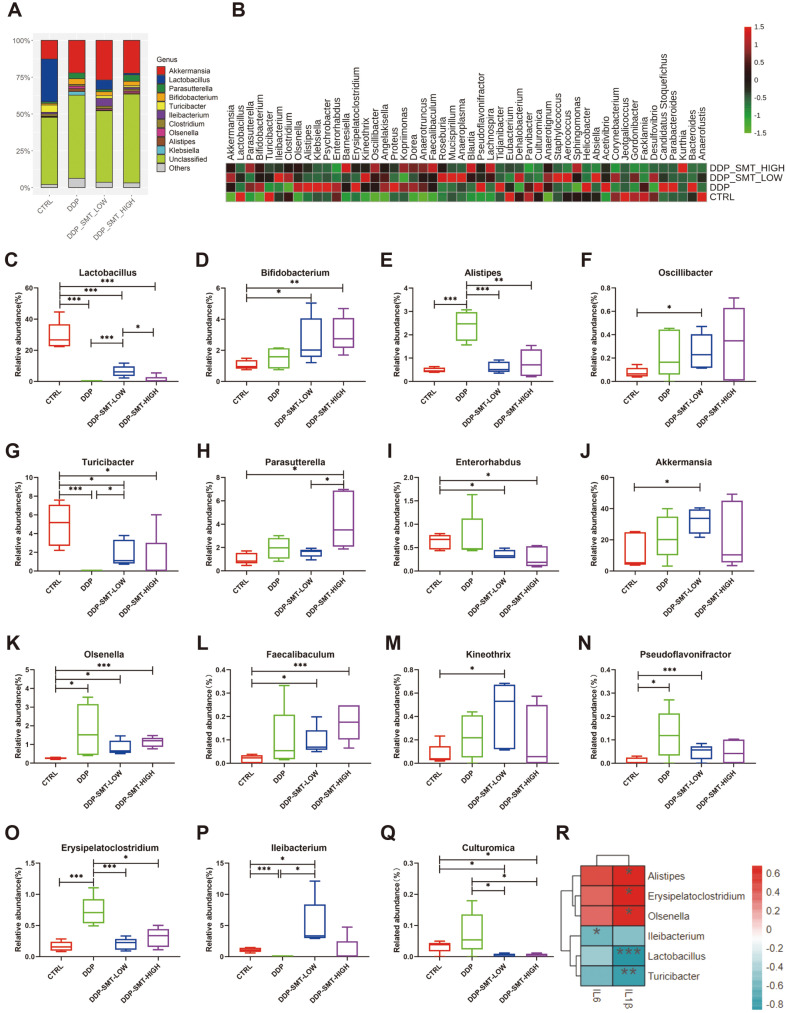
Fig. 6. SMT reduced the side effects of DDP and enhanced the efficacy of DDP by altering the gut microbiota at the ‘genus’ level.
A. Stackbar histogram of the distribution of bacteria in the gut microbiota of mice (‘genus’ level). B. Heatmap of the genus abundance of bacteria in the gut microbiota of mice. C-Q. Analysis diagram of the abundance of each group of mouse gut microbiota. C is the Lactobacillus abundance, D is the Bifidobacterium abundance, E is the Alipites abundance, F is the Oscillibacter abundance, G is the Akkermansia abundance, H is the Olsenella, I is the Faecalibaculum abundance, J is the Kineothrix abundance, K is the Turicibacter abundance, L is the Parasutterella abundance, M is the Erysipelatoclostridium abundance, N is the Ileibacterium abundance, O is the Pseudoflavonifractor abundance, P is the Culturomica abundance, and Q the is Enterorhabdus abundance. R. A heatmap of correlations between genus-level gut microbiota and serum inflammatory factors. Negative correlations are shown in blue, and positive correlations are shown in red. The darker the color, the higher the correlation.

