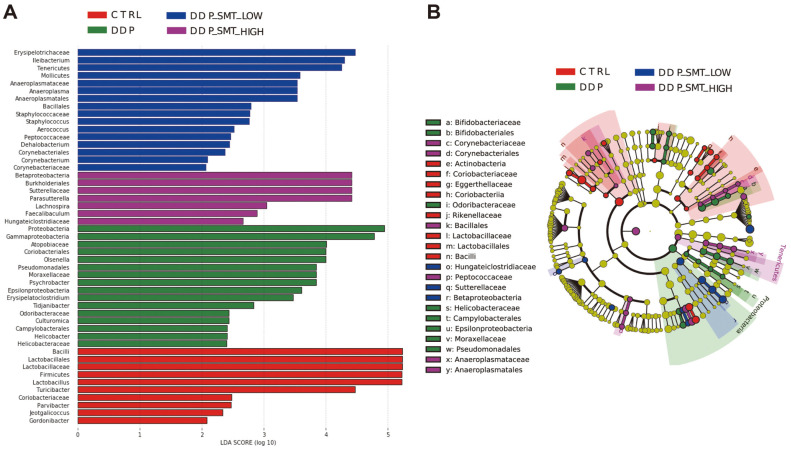
Fig. 7. LEfSe analysis of gut microbiota sequencing.
A. LDA value distribution histogram. The ordinate is the name of the bacterial species with a significant difference in abundance, and the abscissa is its corresponding LDA value. The higher the LDA value, the more obvious the difference is between it and other groups. B. Species evolutionary branch diagram. Different nodes represent different bacterial species, the size of the node represents the abundance of bacterial species, and the circle from inside to outside represents kingdom to genus (kingdom-phylum-class-order-family-genus) classification of bacterial species. Yellow represents the bacteria with no difference, red represents the bacteria with the highest expression abundance and significant difference in the CTRL group, green represents the bacteria with the highest expression abundance and significant difference in the DDP group, blue represents the bacterial species with the highest expression abundance and significant difference in the DDP-SMT-LOW group, and purple represents the bacterial species with the highest expression abundance and significant difference in the DDP-SMT-HIGH group.

