
FIG. 7.
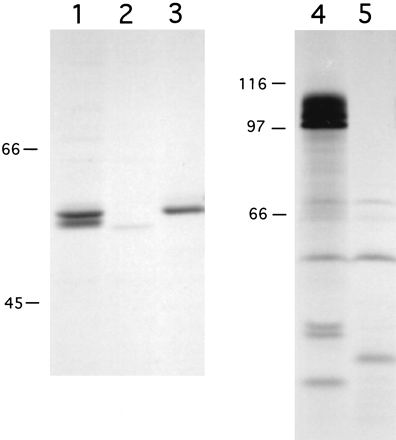
Immunoprecipitation of LLO and ActA from L. monocytogenes-infected J774 cells. Bacterial proteins were metabolically labeled during growth in J774 cells or in vitro and immunoprecipitated with monoclonal anti-LLO antibody B3-19 (lanes 1 to 3) or polyclonal anti-ActA antibody 2553 (lanes 4 and 5). Lanes 1 and 4, 10403S-infected J774 cells; lane 2, DP-L2817 (10403S::pfoH438Y)-infected J774 cells; lane 3, supernatant from 10403S cultured in vitro as described in Materials and Methods; lane 5, DP-L1942 (10403SΔactA)-infected J774 cells. An autoradiograph depicting one of two experiments with similar results is shown. The exposure times for the visualization of ActA and LLO by autoradiography were 18 h and 7 days, respectively. For quantitation of ActA and LLO as described in Results, the gel was scanned with a Molecular Dynamics PhosphorImager, and the resulting images were analyzed with ImageQuant software (Molecular Dynamics). Numbers at left are in kilodaltons.