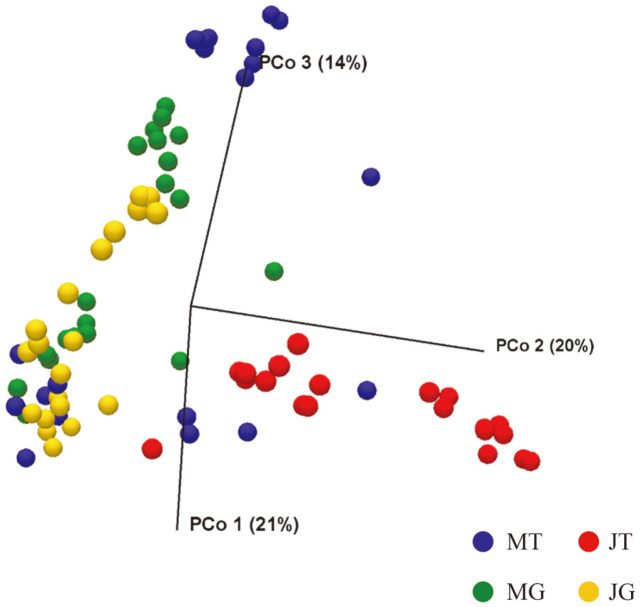
Fig. 1. Principal coordinates analysis plot of Bray-Curtis distance among Chinese chive samples.
Each group is represented as color. The percentage contributions to the variance of the data from principal components 1, 2 and 3 (PCo 1, PCo 2, and PCo 3) are listed along axes representing them. (MT: March-traditional market, JT: June-traditional market, MG: March-grocery store, and JG: June-grocery store).

