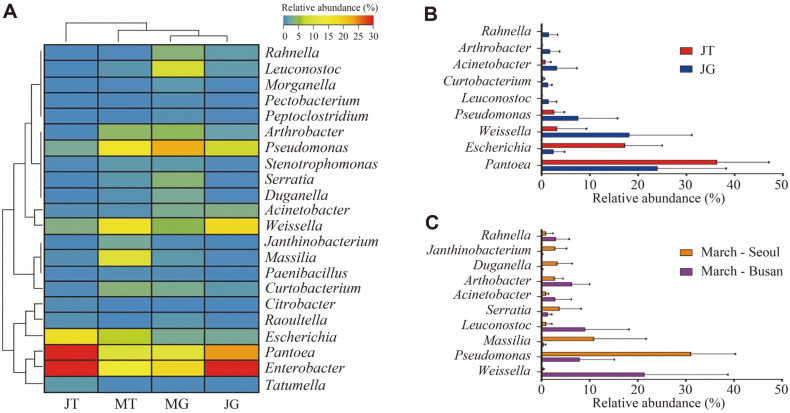
Fig. 3. Analysis of microbiota composition at the genus level on Chinse chive.
(A) Heat-map analysis shows the genus level relative abundance (more than average 0.5% at each group) on Chinse chive samples. Samples were clustered by Spearman’s rank correlation. (MT: March-traditional market, MG: March-grocery store, JT: June-traditional market, JG: Junegrocery store). (B) The relative abundance of genera in Chinese chive samples with statistically significant differences between June-traditional market (JT) and June-grocery store (JG). (C) The relative abundance of genera with statistical differences between March-Seoul and March-Busan.

