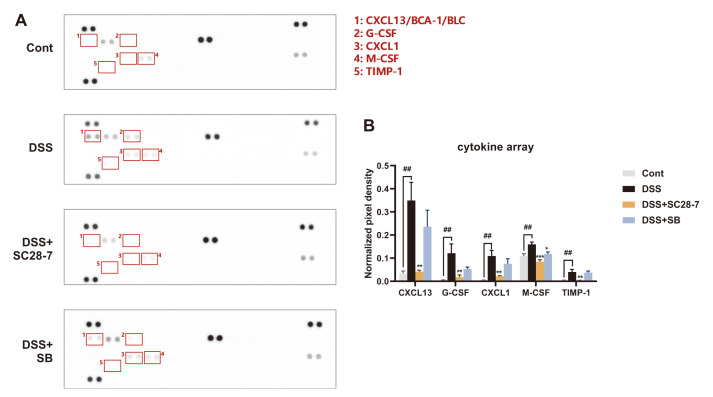
Fig. 4. Effects of SC28-7 administration on DSS-induced inflammatory cytokine secretion in serum.
(A) The representative pictures of the protein blots showing inflammatory cytokine array dots by group (n = 4 serum samples/group). The numbered boxes above the blots indicate the proteins with the significant differences between the Cont and DSS groups shown in the upper right corner. (B) Quantification of the relative spot intensity normalized to positive control spot of each blot. Quantitative analysis was performed using Image J software with four independent experiments. ##p < 0.01 between Cont and DSS, *p < 0.05, **p < 0.01, ***p < 0.001 vs. DSS.

