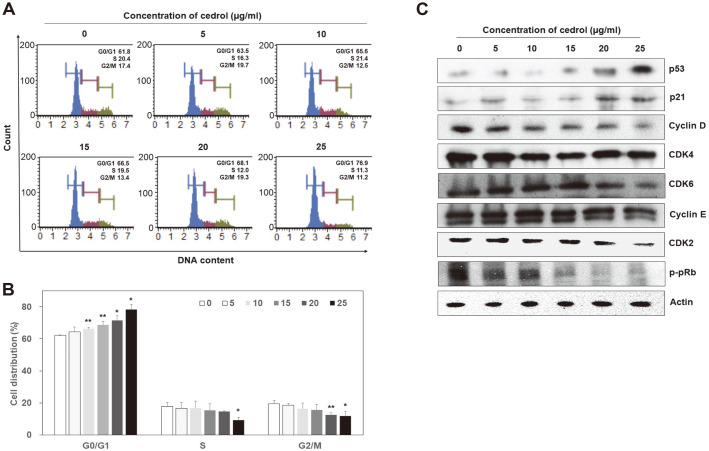
Fig. 3. Cedrol induces G1 arrest of the cell cycle in A549 cells.
(A) After treatment with indicated doses of cedrol for 48 h, cell cycle profiles were evaluated using a Muse Cell Cycle Kit with a Muse Cell Analyzer. (B) Percentages of cell populations in G0/G1, S, and G2/M phases are calculated for each dose of cedrol. Data are presented as mean ± SD of three independent experiments. *p < 0.05 and **p < 0.01 vs. each control. (C) Western blot analysis was performed after treatment with indicated doses of cedrol for 48 h to determine whether the expression of cell cycle-related proteins was altered by cedrol treatment. Actin was used as an internal control.

