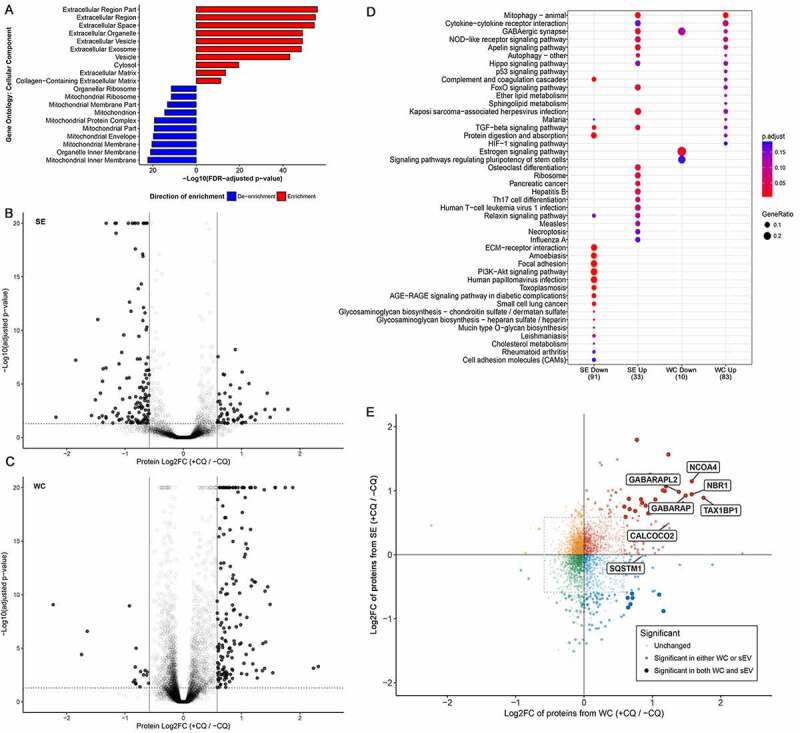
Figure 2.

Chloroquine treatment alters the MDA-MB-213 secretome. (A) All proteins identified from the secreted fraction were used in gene ontology (GO) enrichment analysis to identify enriched cellular components terms relative to the total proteome identified from WC fractions. The top 10 enriched and de-enriched GO terms are shown, and all passed a significance threshold of adjusted p-value < 0.05. See also Table S1, S2. (B) CQ-induced differential protein abundance in the secretome of MDA-MB-231. 189 proteins (4.4% of 4302 identified proteins) were differentially abundant between secretomes of control and CQ-treated MDA-MB-231 cells (solid dots). Threshold for defining significance was set at an adjusted p-value of 0.05 (horizontal dotted line) and an absolute log2-fold change of 0.584 (1.5-fold change, vertical lines). See also Fig. S2D. (C) CQ-induced differential protein abundance in whole cell (WC) lysate of MDA-MB-231. 178 proteins (2.1% of 8512 identified proteins) were differentially abundant between control and CQ-treated MDA-MB-231 cells (solid dots). Threshold for defining significance was set at an adjusted p-value of 0.05 (horizontal dotted line) and an absolute log2-fold change of 0.584 (1.5-fold change, vertical lines). See also Fig. S2C. (D) Bubble chart showing KEGG pathway analysis results of proteins differentially abundant due to CQ treatment. Only the top 20 enriched pathways with adjusted p-value < 0.2 in each condition are shown and are listed on the y-axis. Samples and directionality of the protein fold-changes are represented on the X-axis. Size and color of the bubbles represent proportion of differentially abundant proteins in pathway and their significance, respectively. (E) CQ-induced protein fold changes (log2-scale; Log2FC) in whole cell (WC; X-axis) vs in secreted fraction (SE; Y-axis) are shown as a scatter plot where each dot represents a protein identified in the proteome of both WC and SE. Threshold for defining significance was set at an adjusted p-value of 0.05 and an absolute log2-fold change of 0.584 (1.5-fold change, dotted rectangle). Proteins meeting the fold-change cutoff in both WC and SE datasets are shown as large opaque dots, whereas proteins meeting the cutoff in only one dataset are shown as semi-transparent dots. Each dot is colored according to its direction of fold change in both WC and SE. Proteins of interest, including mammalian Atg8-family orthologs and select autophagy cargo receptors, are labeled. +CQ: CQ-treated; -CQ: not treated. See also Table 1, S2 and Fig. S2E, S2F, S2G.
