Figure 2.

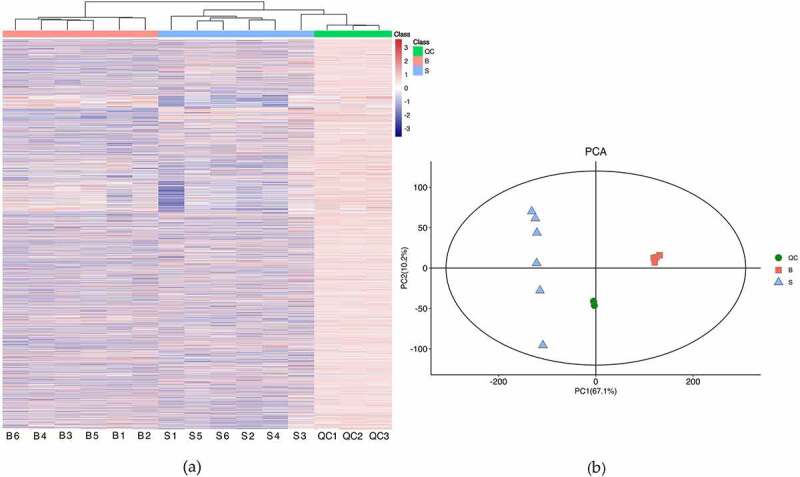
Quality control of samples from biological material. (a) Hierarchical cluster heatmap. (b) Principal component analysis. S and B represent seeds and bark, respectively (the same below). QC represent mixed samples used for quality control.

Quality control of samples from biological material. (a) Hierarchical cluster heatmap. (b) Principal component analysis. S and B represent seeds and bark, respectively (the same below). QC represent mixed samples used for quality control.