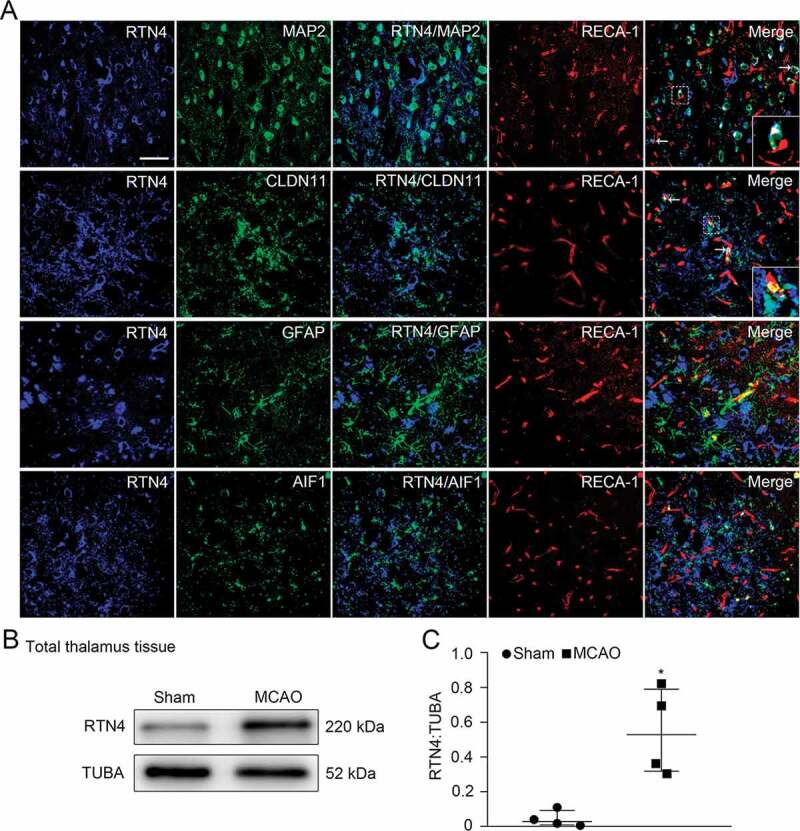
Figure 2.

Colocalization of RTN4 on different cell types in the ipsilateral thalamus after cortical infarction. (A) Triple-staining of RTN4 (blue) with MAP2+ neurons, CLDN11+ oligodendrocytes, GFAP+ astrocytes and AIF1+ microglia (green) and their spatial distribution along RECA-1+ vessels (red) within the ipsilateral thalamus at 7 days after MCAO (arrows). Insets show RTN4-expressing neurons and oligodendrocytes adjacent to RECA-1-labeled vessels. Scale bar: 50 μm. (B) Immunoblotting shows RTN4 expression in the ipsilateral thalamus of the sham- and MCAO-operated animals. (C) Quantitative analysis of RTN4 level relative to TUBA. n = 4, data are expressed as median ± interquartile range. *P < 0.05, compared with the sham-operated controls.
