Figure 3.

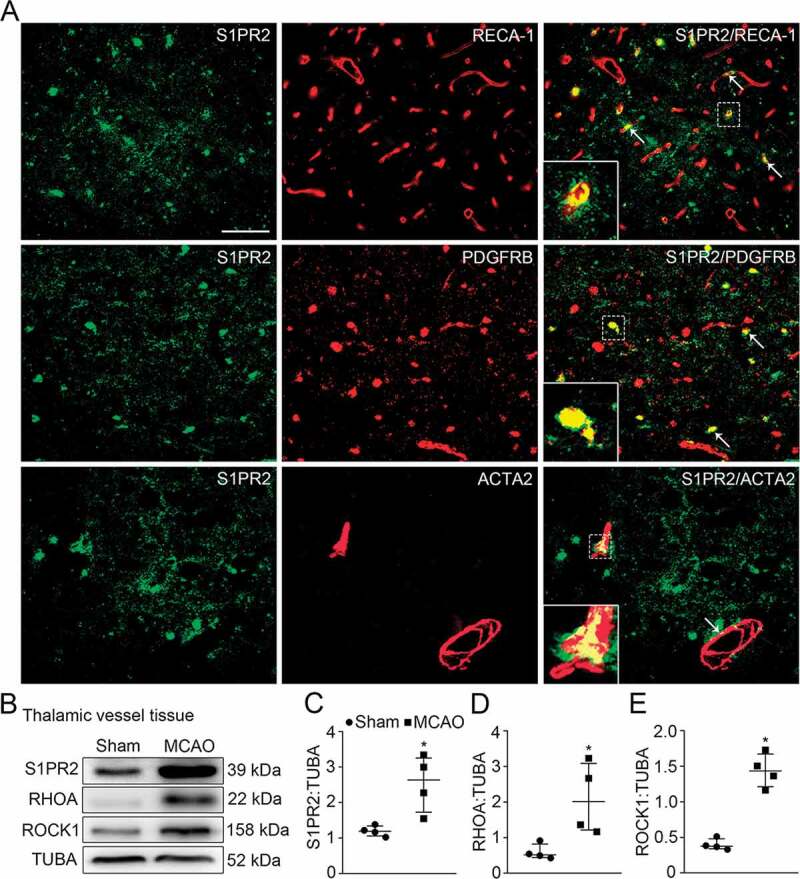
Expression profiles of S1PR2 and its downstream molecules in vessels of the ipsilateral thalamus after cortical infarction. (A) Co-staining of S1PR2 (green) with RECA-1+ endothelial cells, PDGFRB+ pericytes, or ACTA2+ smooth muscle cells (red) within the ipsilateral thalamus in the MCAO group (arrows). Scale bar: 50 μm. (B) Immunoblotting shows the expression of S1PR2, RHOA and ROCK1 in vessels of the ipsilateral thalamus from the sham- and MCAO-operated animals. (C-E) Quantitative analysis of S1PR2, RHOA and ROCK1 levels relative to TUBA. n = 4, data are expressed as median ± interquartile range. *P < 0.05, compared with the sham-operated controls.
