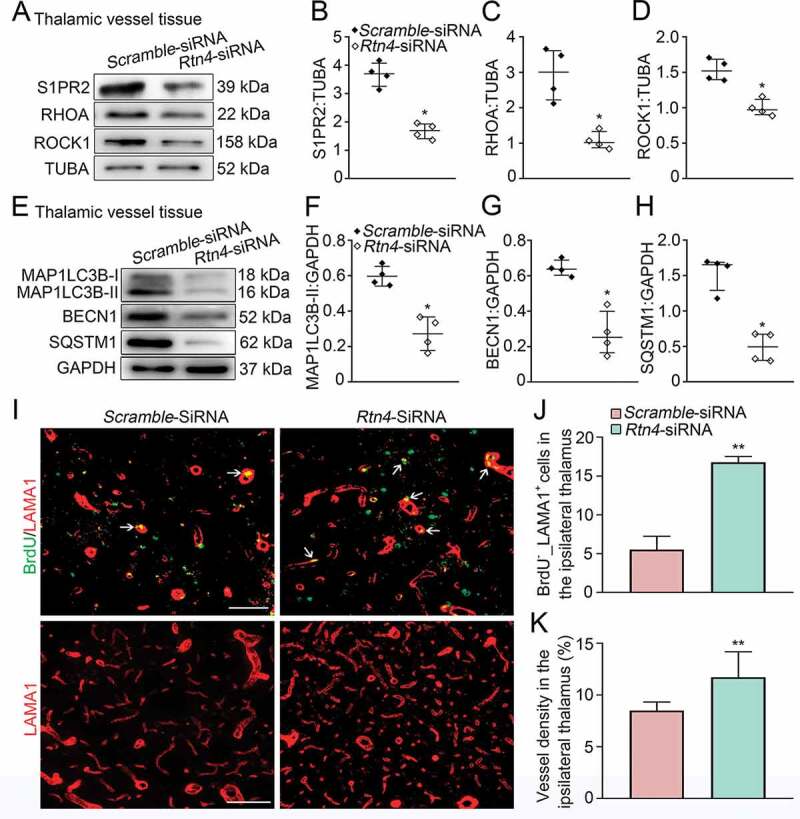
Figure 5.

Rtn4 knockdown and vascular autophagic activation, as well as angiogenesis the ipsilateral thalamus after cortical infarction. (A) Immunoblotting shows the expression of S1PR2, RHOA and ROCK1 in vessels of the ipsilateral thalamus in the Scramble- and Rtn4-siRNA groups at 7 days after MCAO. (B-D) Quantitative analysis of S1PR2, RHOA and ROCK1 levels relative to TUBA. n = 4, data are expressed as median ± interquartile range. *P < 0.05, compared with the Scramble-siRNA group. (E) Immunoblotting shows the expression of MAP1LC3B-II, BECN1 and SQSTM1 in vessels of the ipsilateral thalamus in the Scramble- and Rtn4-siRNA groups. (F-H) Quantitative analysis of MAP1LC3B-II, BECN1 and SQSTM1 levels relative to GAPDH. n = 4, data are expressed as median ± interquartile range. *P < 0.05, compared with the Scramble-siRNA group. (I) Co-staining of BrdU (green) with LAMA1 (red) in the ipsilateral thalamus of the Scramble- and Rtn4-siRNA groups at 7 days after MCAO (arrows). Scale bar: 50 μm, 100 μm. (J and K) Quantitative analysis of BrdU+_LAMA1+ cells and vessel density. n = 6, data are expressed as median ± interquartile range. **P < 0.01, compared with the Scramble-siRNA group.
