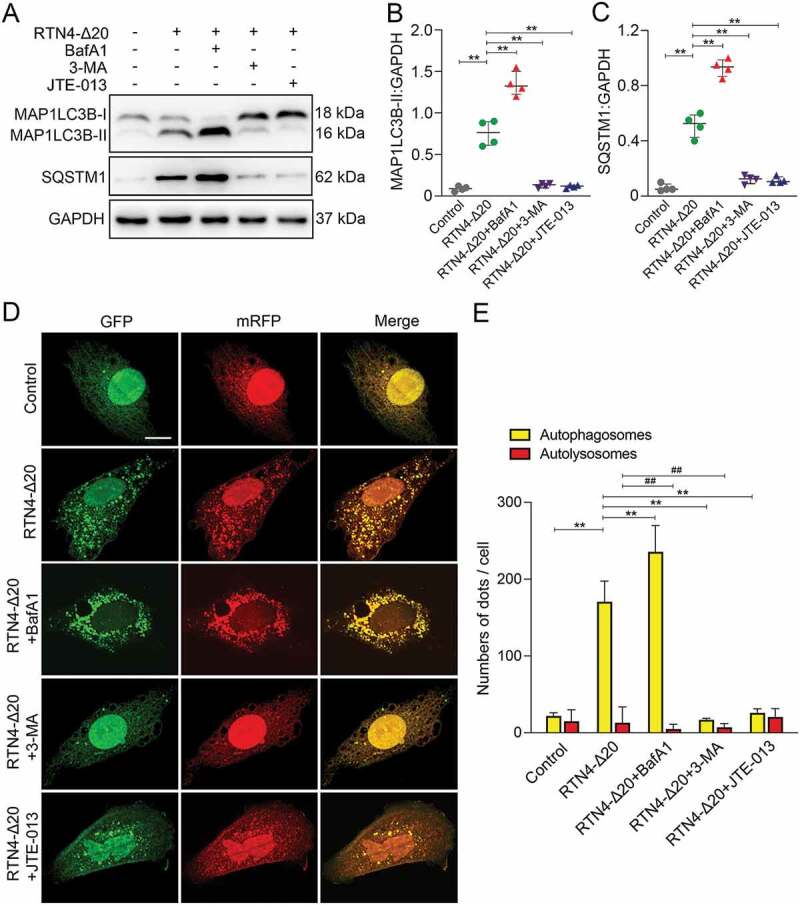
Figure 11.

RTN4-S1PR2 induced autophagy in BMVECs. (A) Immunoblotting analysis shows the expression of MAP1LC3B and SQSTM1 in BMVECs in the absence or presence of RTN4-Δ20 individual, or in combination with BafA1, 3-MA or JTE-013. (B and C) Quantitative analysis of MAP1LC3B-II and SQSTM1 levels relative to GAPDH. n = 4 from four independent experiments, data are expressed as median ± interquartile range. **P < 0.01, one-way ANOVA. (D) Representative confocal microscopic images of LC3B puncta in BMVECs transfected with mRFP-GFP-LC3 in the absence or presence of RTN4-Δ20 alone or in combination. Autophagosomes are indicated by yellow dots with both GFP and RFP, and autolysosomes by free red dots with only RFP in merged images. Scale bar: 20 μm. (E) Quantitative analysis of autophagosomes and autolysosomes per cell. n = 20–30 cells of four independent experiments, data are expressed as median ± interquartile range. **P < 0.01 (autophagosomes), ##P < 0.01 (autolysosomes), one-way ANOVA.
