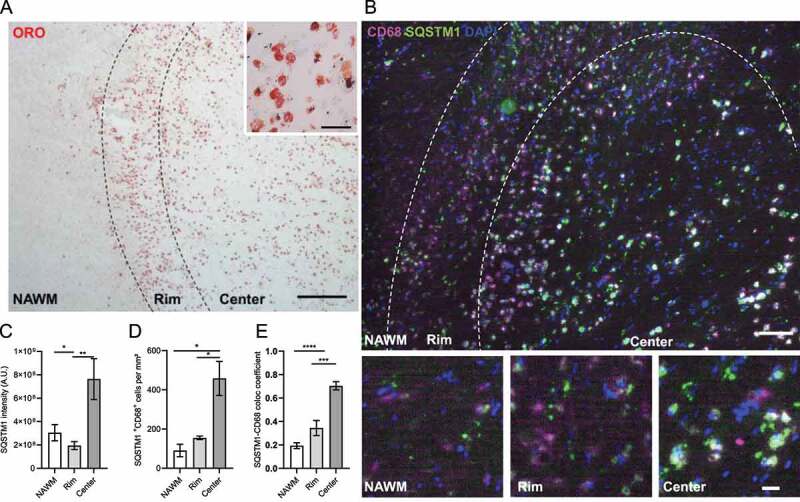
Figure 1.

MS lesions show signs of dysfunctional autophagy. (A,B) Representative images of an active MS lesion stained with (A) Oil red O (ORO) or (B) CD68 (magenta) and SQSTM1 (green). (C,D) Quantification of (C) SQSTM1 intensity and (D) the number of phagocytes expressing SQSTM1. (E) Colocalization coefficient of CD68 and SQSTM1. n = 3 lesions from 3 different MS patients. Scale bar: (A, overview) 500 µm, (A, inset) 50 µm, (B, overview) 100 µm, (B, inset) 20 µm. White arrows indicate colocalization. All data are represented as mean ± SEM. *p < 0.05 and **p < 0.01.
