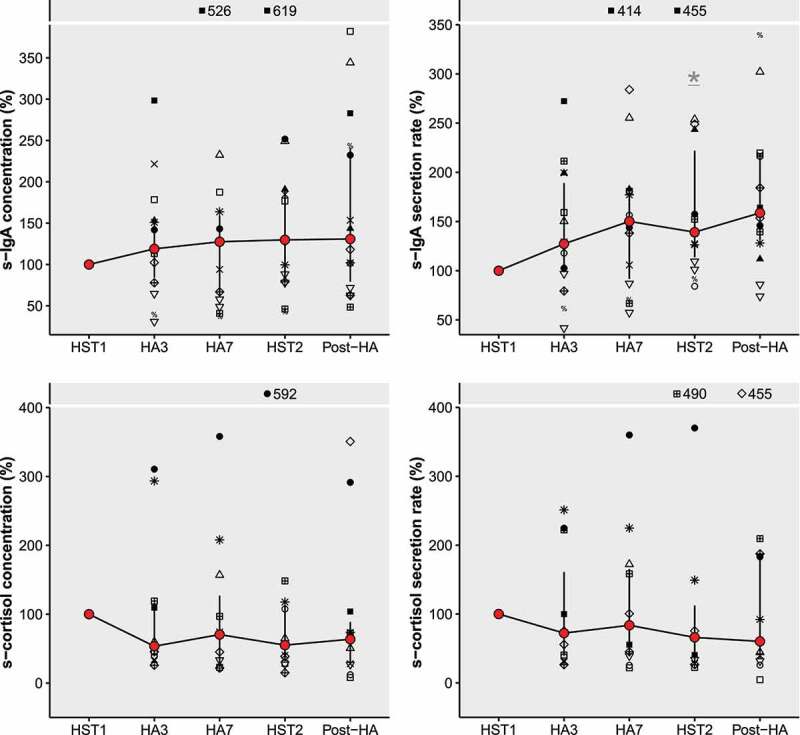
Figure 2.

Salivary immunoglobulin-A (s-IgA) and salivary cortisol (s-cortisol) concentrations and secretion rates expressed as percentage change from HST1, with HST1 = 100%. Connected red points represent medians, with error bars ranging from Q1 to Q3. Symbols represent individual participant datapoints, where female datapoints have black fill. Outliers that fell out of the plot window were displayed with their percentage at the top of all panels. * Significantly different from HST1 (statistical testing was done using the absolute values). Abbreviations: HST, heat stress test; HA, heat acclimation.
