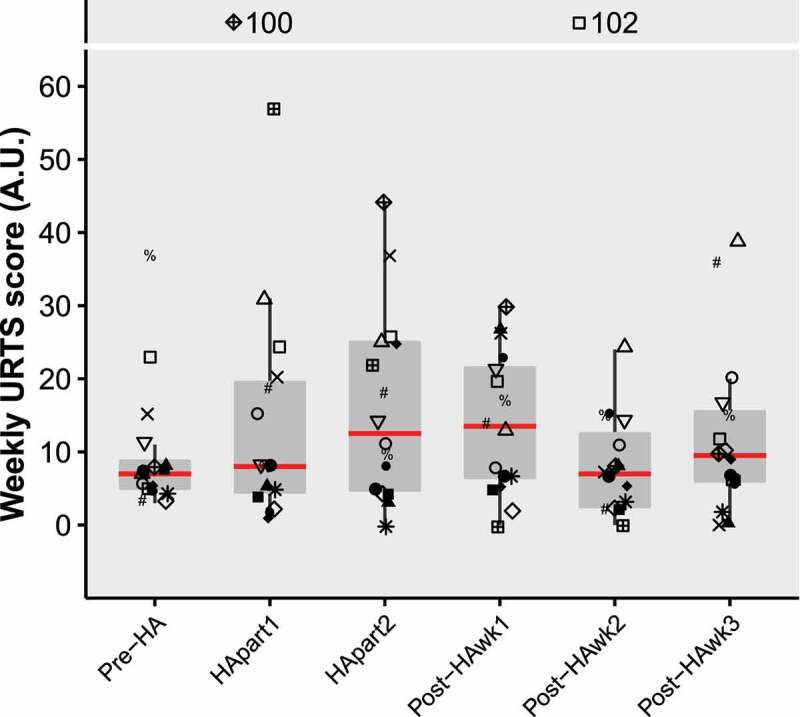
Figure 3.

Boxplots of weekly URTS scores over time. Red lines represent medians. Symbols represent individual participant datapoints, where female datapoints have black fill. Outliers that fell out of the plot window were displayed with their value at the top of the figure. Abbreviations: URTS, upper-respiratory tract symptoms; HA, heat acclimation; wk, week.
