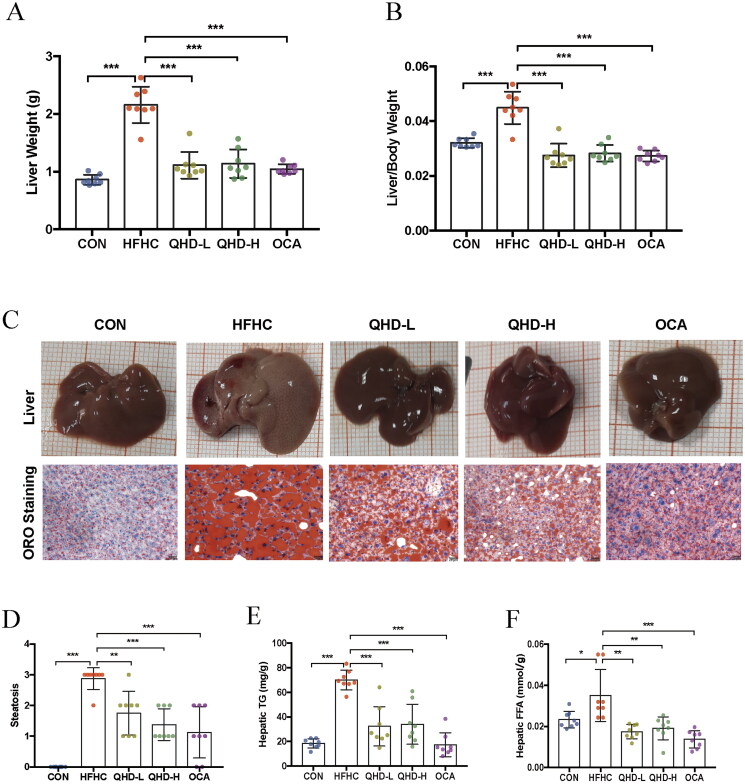
Figure 3.
QHD attenuated lipid accumulation in NASH mice. (A) Liver weight. (B) Liver index. (C) Representative ORO staining of liver tissue from mice showed histologic differences (200*). (D) The score of steatosis in liver. (E) Hepatic TG level. (F) Hepatic FFA level. n = 8, All data are expressed as mean ± SD. *p < 0.05, **p < 0.01, ***p < 0.001.

