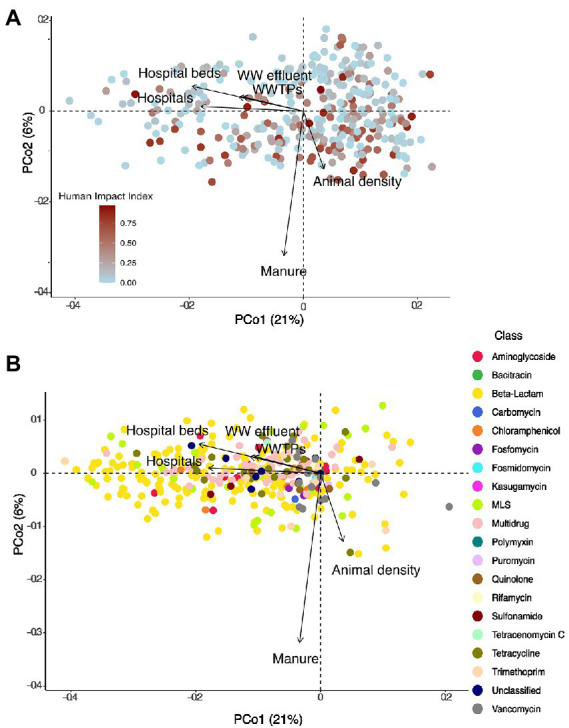
Figure 5.

(A) PCoA showing the distribution of 349 lake samples (based on presence-absence data) projected in the first two dimensions. Each sample is colored by its HII. Arrows show variables that significantly correlated with the ordination after environmental fitting. (B) PCoA showing the distribution of individual resistance genes (based on presence-absence data) projected in the first two dimensions. Each resistance gene is colored by its class. Arrows show variables that significantly correlated with the ordination after environmental fitting.
