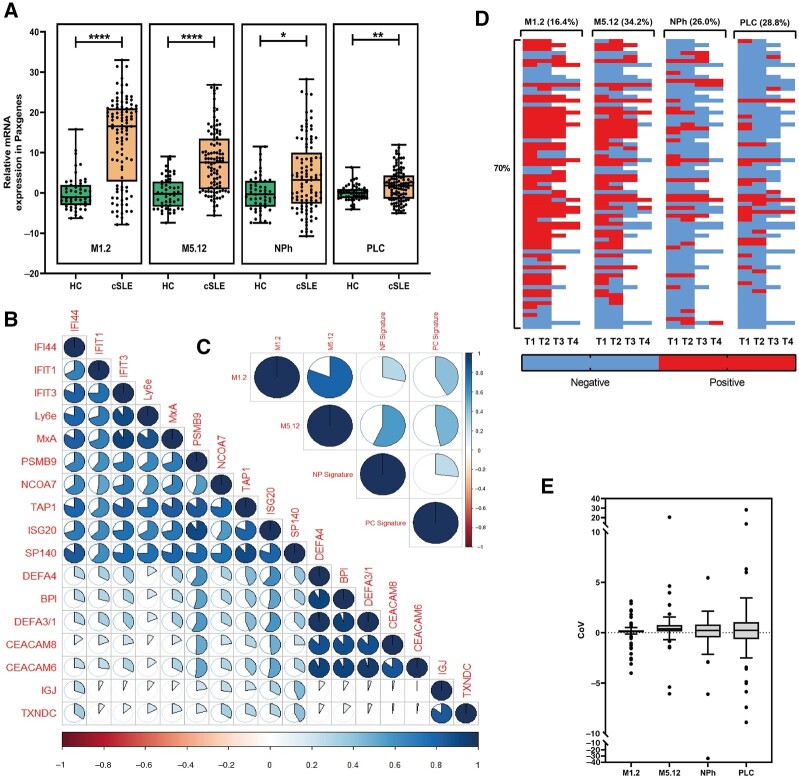
Fig. 1.
Four dynamic gene signatures are present in cSLE patients
(A) Relative expression of four gene signature scores in HCs (N = 51) vs cSLE patients (N = 101). (B) Correlation matrix between gene signature–associated genes based on relative expression. (C) Correlation matrix between each individual gene signature. (D) Heatmap indicating a positive or negative gene signature score over time in 73 cSLE patients. Each row represents the same patient. Horizontal percentages indicate the number of patients who showed a dynamic signature over time. The vertical percentage indicates the number of patients with at least one dynamic gene signature. (E) Coefficient of variation (CoV) per gene signature indicating the intra-individual difference per gene signature. Each dot represents the CoV of one patient. Lines indicate the mean (s.d.). The Mann–Whitney U-test was used to compare two groups; *P < 0.05; **P < 0.01; ***P < 0.001; ****P < 0.0001. For correlations, Spearman’s rho was used. A full circle represents a rho of 1. cSLE: childhood-onset SLE; HC: healthy control; NPh: neutrophil signature; PLC: plasma cell signature; T: time point.

