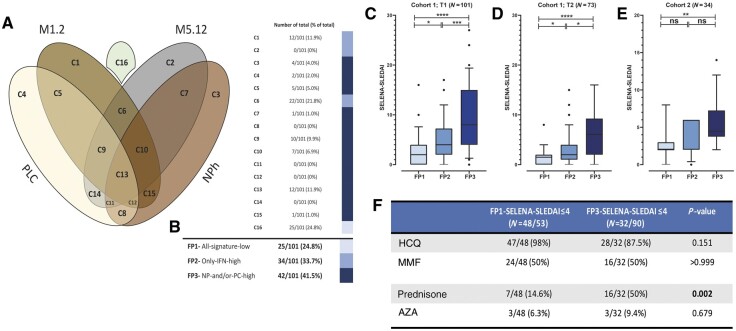
Fig. 3.
Gene fingerprints identify SLE patients with similar disease activity
(A) Venn diagram of gene clusters. Overlap between the ellipses in the Venn diagram indicates a positive gene score for the involved gene signatures. (B) Patient distribution over three fingerprint groups. Coloured bars represent the clusters that are involved in each fingerprint. (C) SELENA-SLEDAI distribution per fingerprint group in cSLE cohort-I; first time point (n = 101). (D) SELENA-SLEDAI distribution per fingerprint group in cSLE cohort-I; second time point (n = 73). (E) SELENA-SLEDAI distribution per fingerprint group in cSLE cohort-II; replication cohort (n = 34). (F) Medication use in patients with FP1 and FP3 with a SELENA-SLEDAI of ≤4. Dots represent individual patients. The Mann–Whitney U-test was used to compare the two groups; *P < 0.05; **P < 0.01; ***P < 0.001; ****P < 0.0001. cSLE: childhood-onset SLE; FP: fingerprint; NPh: neutrophil signature; ns: not significant; PLC: plasma cell signature; SELENA: Safety of Estrogen in Lupus National Assessment; T: time point.

