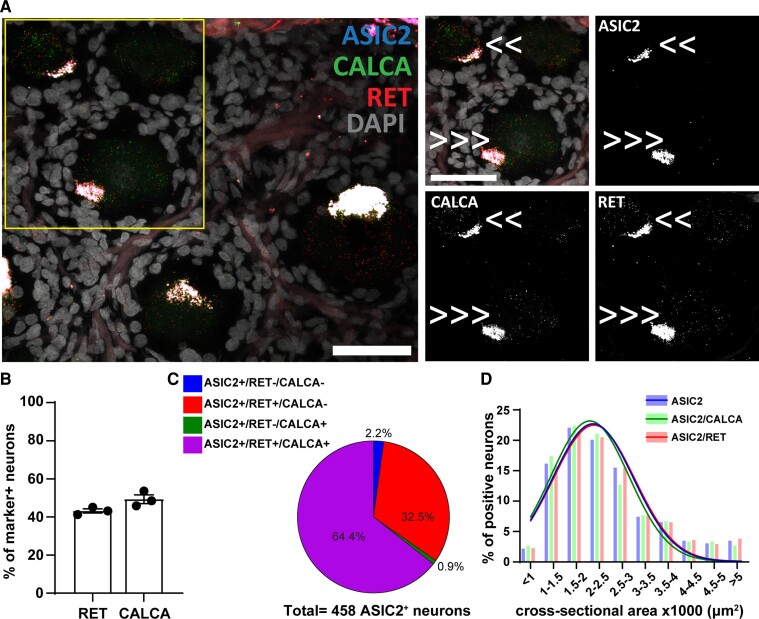
Figure 2.
ASIC2 expression in CALCA+and RET+ primary sensory neurons. (A) Representative confocal image showing the expression of ASIC2 (Acid-Sensing Ion Channel 2) in primary sensory neurons expressing RET (receptor tyrosine kinase RET) and CALCA (Calcitonin gene-related peptide). Τhe region within the rectangle is further highlighted on the right-side images. Double arrows point to cells expressing two genes, and triple arrows point to cells expressing all the three genes. Scale bar = 50 μm. (B) Percentage of marker positive neurons expressing ASIC2; n = 3 DRGs from three donors. (C) Pie chart showing the distribution of ASIC2 positive neurons in the experiment #2; n = 458 ASIC2+ neurons from three samples. (D) Histogram along with fitting curves of the neuronal size distribution (bin = 500 μm2) of ASIC2+ neurons and ASIC2/marker double positive neurons in human DRGs; Welch one-way ANOVA, W(DFn, DFd) = 0.4565(2.000,4.000) P = 0.66, 299–458 neurons from three samples. Detailed sample size can be found in Supplementary Table 1

