Figure 5.
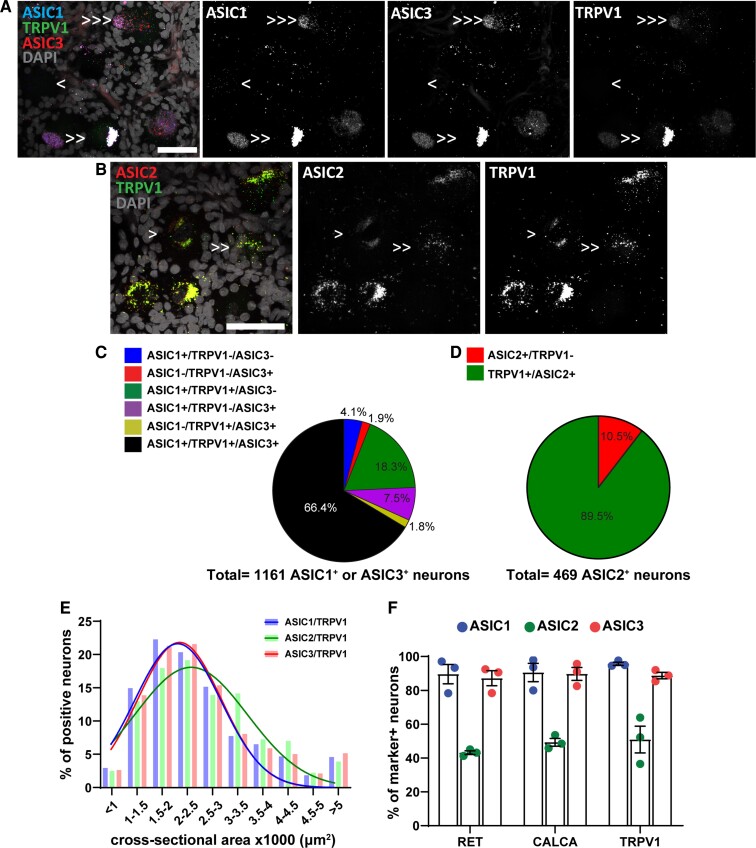
ASICs expression in TRPV1+ primary sensory neurons. (A) Representative confocal image showing the expression of ASIC1 (Acid-Sensing Ion Channel 1), ASIC3(Acid-Sensing Ion Channel 3) and TRPV1+ (Transient Receptor Potential Cation Channel Subfamily V Member) sensory neurons. (B) Representative confocal image showing the expression of ASIC2 (Acid-Sensing Ion Channel 2) and TRPV1+ sensory neurons. Single arrow points to cell expressing only one gene, double arrows point to cells expressing two genes, and triple arrows point to cells expressing three genes. Scale bar = 50 μm. (C) Pie chart showing the distribution of DRG neurons expressing different combinations of ASIC1, ASIC3, and TRPV1 from experiment #5; n = 1161 ASIC1 or ASIC3 positive neurons from three samples. (D) Pie chart showing the distribution of DRG neurons expressing different combinations of ASIC2 and TRPV1 from experiment #6; n = 469 ASIC2 positive neurons from three samples. (E) Histogram along with fitting curves of the neuronal size distribution (bin = 500 μm2) of ASICs/TRPV1 double positive neurons in human DRGs; Welch one-way ANOVA, W(DFn, DFd) = 3.245(2.000, 3.943), P = 0.15, 420–983 neurons from three samples. (F) Percentage of marker positive neurons expressing different ASIC subunits; n = 3 DRGs from three donors. Part of this graph is duplication from Figs 1B, 2B, and 3B. Detailed sample size can be found in Supplementary Table 1

