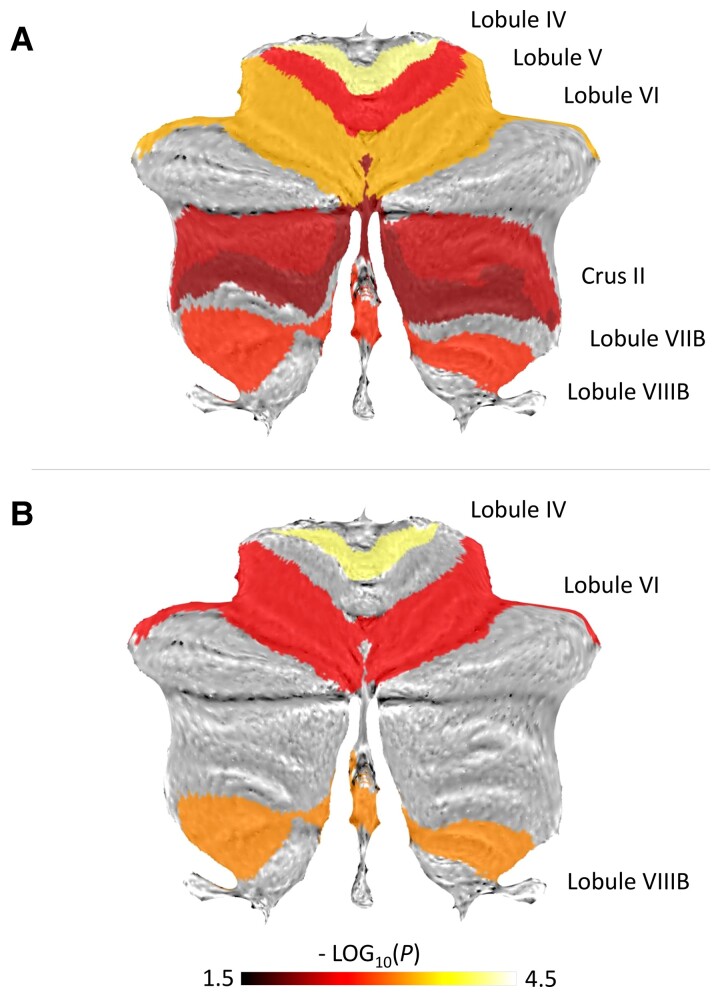
Figure 1.
Cerebellar brain volumes and outcome after stroke. Labels exhibiting significant association between regional volume and MRS at T2 are visualized on a cerebellar flatmap template with colours indicating-log10(P). A Regression results without adjustment for the initial clinical deficit. B Regression results with adjustment. P values (uncorrected) are derived from individual regression models

