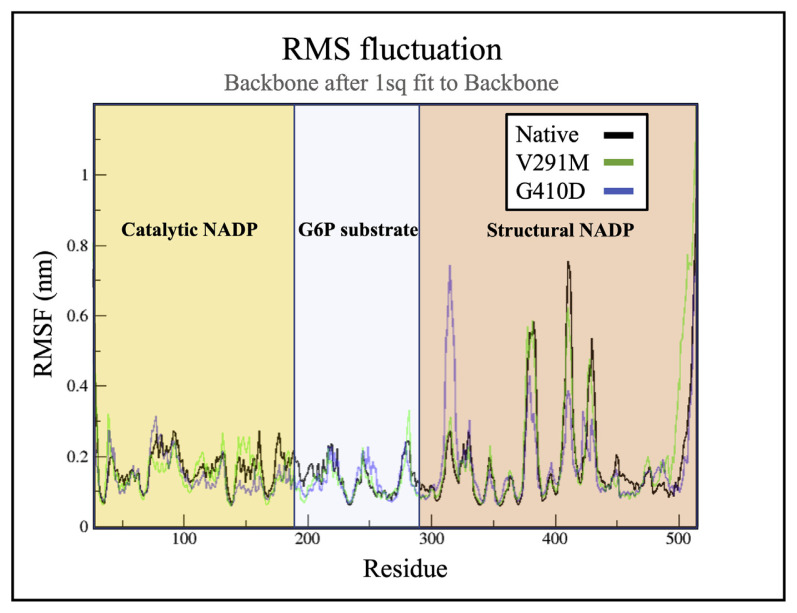
Fig. 3.
RMSF of the carbon α atoms throughout the simulation for variants G410D (blue) and V291M (green) against the native protein (grey), where the yellow, blue and red layout represent residues which are involved in making the binding pockets of the catalytic NADP, glucose-6-phosphate and structural NADP respectively.

