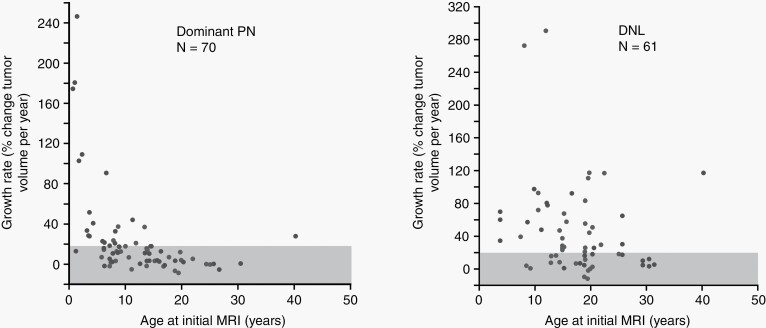
Fig. 4.
Tumor growth rate plotted against patient’s age at initial MRI for plexiform neurofibromas (PN) (A) and distinct nodular lesions (DNL) (B). A moderate negative correlation was observed for PN, whereas only a weak association was noted for DNL. Adapted from Akshintala S, et al. Neuro Oncol. 2020.6Reprinted with permission.

