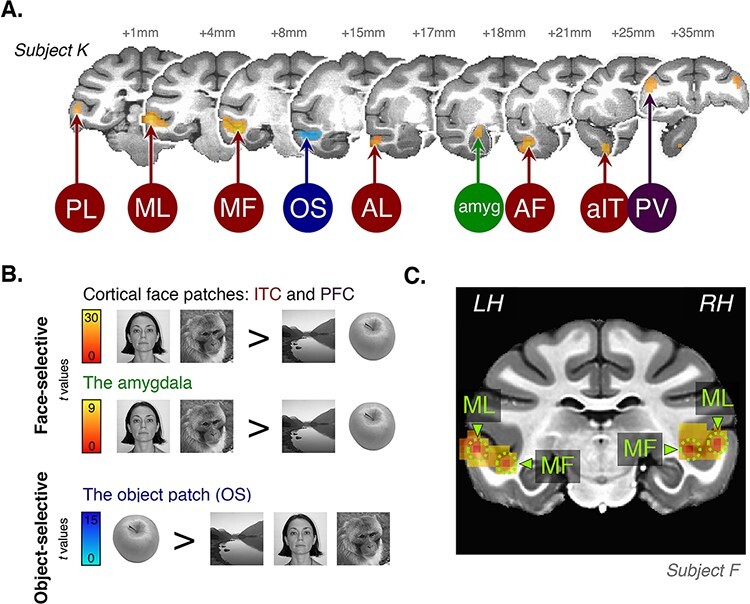
Fig. 1.

Functional localization for Experiments 1 and 2. (A) Individual subject anatomy (Subject K) showing t-score maps for the face-selective (hot colors) and OS (blue colors) contrasts. The white dotted line approximates the anatomical boundary of the amygdala which was used to mask the localization data when defining the amygdala region of interest. (B) The contrasts used to define the ROIs in (A). (C) Localizer data from a single subject—this coronal slice (∼6 mm anterior to the interaural line) illustrates the procedure localization of the separate face patches. Arrows point towards the location of the peak activations associated with the neighboring face patches, ML and MF. The dotted circular apertures represent the relative size of the spheres used to define the face patches.
