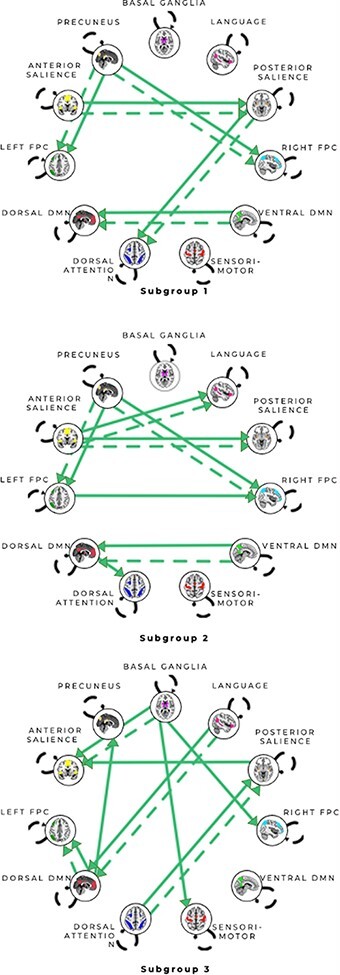
Fig. 2.

Connectivity patterns for unsupervised subgroup solution for all scans from the anger and anxiety conditions. All arrows represent subgroup-level paths there are no shared paths across these subgroups. Solid arrows represent contemporaneous relationships, and dashed arrows represent lagged (X at time minus 1 (T-1) predicts Y at time (T)) relationships. Autoregressive paths (X at T-1 predicts X at T) appear as dashed loops. Subgroup 1 consisted predominantly of anger runs (63.6% anger runs); Subgroup 2 was a mixed group (46.2% anger runs vs 53.9% anxiety runs) and Subgroup 3 consisted predominantly of anxiety runs (81.8% anxiety runs). See Figures S5–7 for matrices reflecting the counts of paths visualized here.
