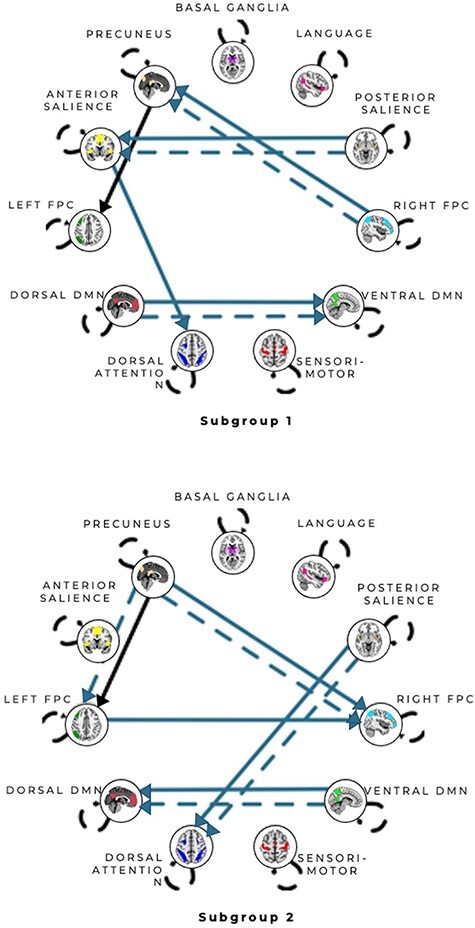
Fig. 4.

Connectivity patterns for unsupervised subgroup solution for the anger condition. All arrows represent subgroup-level paths with the exception of the solid arrow from the precuneus network to left FPC network path which was shared by both subgroups. Solid arrows represent contemporaneous relationships and dashed arrows represent lagged (X at T-1 predicts Y at T) relationships. Autoregressive paths (X at T-1 predicts X at T) appear as dashed loops. See Supplementary Figures S8–9 for matrices reflecting the counts of paths visualized here.
