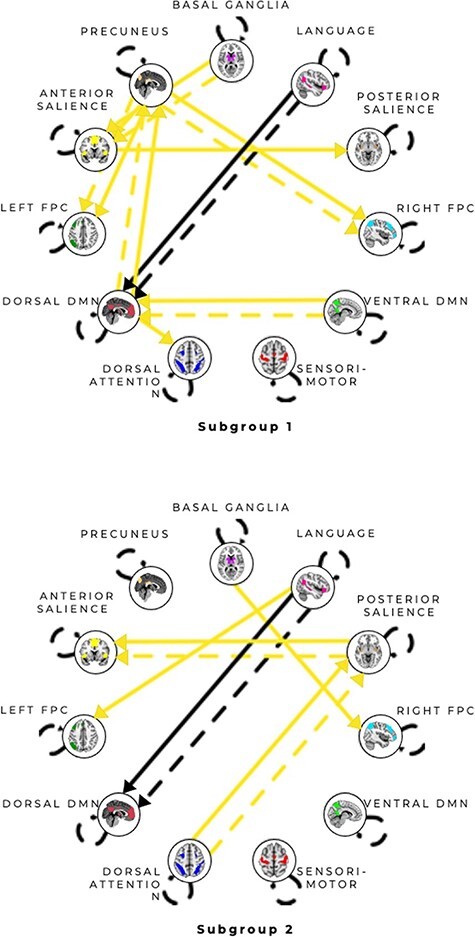
Fig. 5.

Connectivity patterns for unsupervised subgroup solution for the anxiety condition. All arrows represent subgroup-level paths with the exception of a Language network to the dDMN path, which was shared by both subgroups. Solid arrows represent contemporaneous relationships, and dashed arrows represent lagged (X at T-1 predicts Y at T) relationships. Autoregressive paths (X at T-1 predicts X at T) appear as dashed loops. See Supplementary Figures S10–11 for matrices reflecting the counts of paths visualized here.
