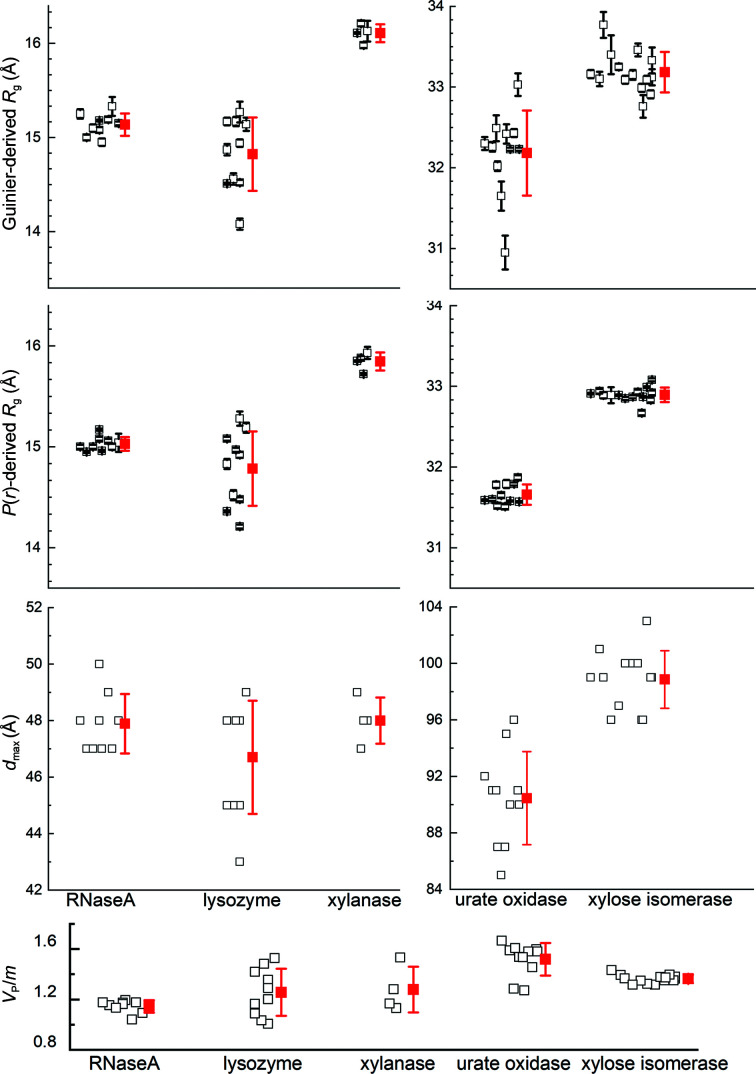
Figure 2.
Distribution of Guinier and P(r)-derived R g values, d max values and the Porod volume to molecular mass ratio (V P/m) for the data contributing to the consensus SAXS profiles for each protein. Individual experimental values are represented as black open squares, with horizontal offsets for clarity and error bars for R g values (standard errors). Red squares represent the mean values for each set, with error bars indicating ±1 standard deviation.

