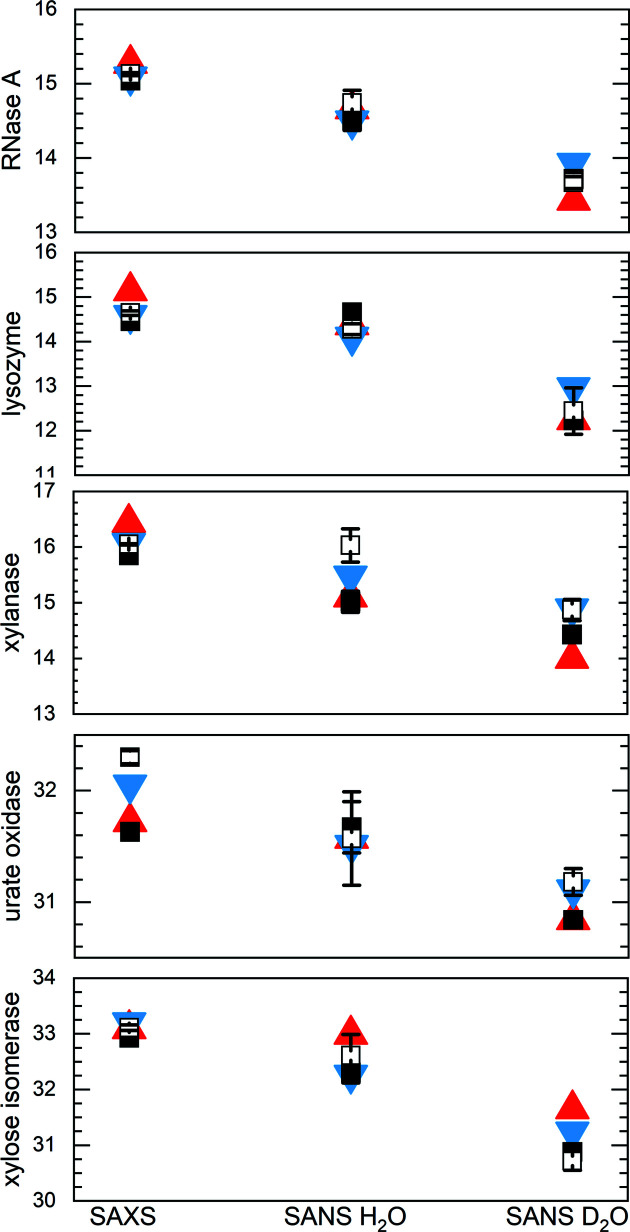
Figure 6.
Guinier- and P(r)-derived R g values (open and filled black squares, respectively) for RNaseA, lysozyme, xylanase, urate oxidase and xylose isomerase consensus profiles for SAXS, SANS in H2O and SANS in D2O measurements (Tables 2 ▸ and 3 ▸) compared with R g values predicted with CRYSOL/CRYSON (red filled triangles) and WAXSiS (blue filled inverted triangles) (Supplementary Table S8). Where they are not evident, error bars for R g from the consensus curve are smaller than the symbols.

