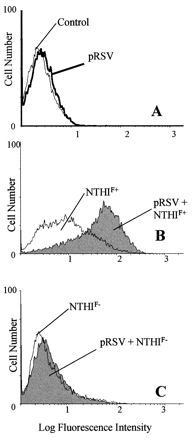
FIG. 2.

Histographic representation of number of A549 cells (y axis) expressing red fluorescence of PKH-26-labeled NTHI (x axis), as determined by flow cytometry (A549:NTHI = 1:100). (A) Background fluorescence of pRSV-exposed (MOI = 1, 24 h) or control A549 cells; (B and C) fluorescence of NTHIF+ and NTHIF− attached to control or pRSV-exposed A549 cells.
